
Quick Answer
Start by locking cohorts and definitions, then issue explicit proceed, hold, or defer calls for each market. Use hard checkpoints such as Form 8938 year mapping, separate FinCEN Form 114 review, unresolved payout exceptions, and reconciliation lag before approving launch. Require a KPI dictionary with formula, data source, and caveats for every metric. If ownership or baseline evidence is missing, keep the market out of the queue.
Introduction and how to use this report#
Use this report as an expansion decision filter, not a KPI scoreboard. Its job is to help platform founders and Payments Ops teams rank where to expand next by weighing upside and execution load before product or go-to-market work starts.
A useful quarterly benchmark should work like peer benchmarking in finance operations, not like a recap. In accounts payable, benchmarking matters because it compares performance against peers and competitors using quantitative and qualitative metrics to improve decisions. Use the same standard here. If a metric does not help you choose, sequence, pause, or reject a market, it should not drive the decision.
Read it like an expansion filter#
Start by ranking each candidate market against three questions. That ranking matters more than quarter-to-quarter optics or broad industry charts.
- How much upside is available if collection and payout execution work as expected?
- How much operational effort is required for payment-method support, exception handling, and support load?
- How much execution friction or uncertainty will you carry before launch and through quarter close?
Search results often surface broad benchmark reports. They can add context, but they are not enough on their own for platform rollout decisions. That is why this article lays out a practical internal quarterly standard with clear decision use.
This matters because payments expansion is fragmented and execution-sensitive. Payment-method choices and payout execution add complexity. Weak execution usually shows up as slow transactions, failed payments, or poor support for preferred methods. A market with stronger headline volume can still rank below a smaller market you can serve cleanly.
Start with a trust check. Every benchmark input should map to a known source and a relevant peer group. Exception monitoring is one concrete checkpoint. If your team cannot explain shifts in exceptions, failure patterns, or mix effects, the benchmark is not reliable enough for expansion sequencing.
Avoid vanity reporting. Each quarter, this report should produce three outputs: a ranked market view, a short list of launch candidates, and a clear list of markets to defer.
If you want a deeper dive, read State of Platform Payments: Benchmark Report for B2B Marketplace Operators.
What this benchmark is and what it is not#
This benchmark is a decision tool, not a quarterly highlight reel. Here, a platform payments quarterly benchmark report refers to a recurring operator report that uses consistent definitions over time so performance can be compared against peers, broader norms, and your own historical baseline.
Benchmarking only adds value when it adds context. Compare performance against peers, broader norms, and your own historical baseline. Internal benchmarks are valid, especially when external comparables are thin or mismatched to your model.
What belongs in scope#
Keep the scope narrow. Include only metrics that are comparable, repeatable, and decision-relevant:
- peer, norm, and internal-baseline comparisons built from consistent definitions
- operational checkpoints you can track end to end (for example, invoice processing from receipt to payment)
- segments that reflect your context, including industry, business size, and goals
- metrics with clear definitions, source lineage, and time windows
If a metric is not comparable across business models, remove it. If it cannot inform an operational decision, remove it.
What does not count#
Narrative documents are context, not operator evidence. A corporate filing format like a Form 10-K can help with background, but it is not benchmark guidance on its own.
A metric is not benchmark-ready if you cannot explain how it was defined, sourced, and segmented. If the denominator, cohort, or time window is unclear, treat it as background only. The same applies when standards do not fit your business context or when sources are gated, inaccessible, or methodologically vague.
We covered this in detail in How Platform Operators Triage Late B2B Payments Before Market Entry.
Build the peer cohort before you compare numbers#
Set the peer cohort before you read performance. If unlike businesses, markets, or operating setups are blended into one average, the benchmark can look precise while still sending the wrong decision signal.
Use a documented cohort rationale you can defend in governance review. For each cohort row, record why it is included, what source of record supports it, and why that group is the basis for the decision.
Make the comparison cuts explicit#
Do not hide material differences inside a generic "platform peers" bucket. Split cohorts on factors that actually change how metrics behave, such as business model and market context.
A practical rule helps here. If a cut changes metric interpretation, include that cut in the cohort definition. If it does not, keep the structure simpler.
Separate operating models before reading outcomes#
Keep materially different operating models in separate rows. Apply the same treatment to process differences that can change execution patterns.
| Cohort slice | Include when | Exclude when | Confidence check |
|---|---|---|---|
| Market context | Conditions are comparable and rationale is documented | Markets are merged only to increase sample size | Sample is large enough to defend the comparison |
| Operating model | Model assignment is consistent and traceable | Different models are blended without labeling | Source systems agree before final comparison |
| Business model alignment | Metric definitions are comparable for the model | Different models are compared on mismatched metrics | Chosen metrics reflect the model being benchmarked |
| Process depth | Material process differences are tagged | Major process differences are hidden in one row | Friction can be interpreted without guesswork |
Tag friction drivers, not just outcomes#
Outcomes alone are not enough. Put performance metrics next to process depth where execution conditions differ. Otherwise, you can end up labeling expected process friction as execution failure.
Before publishing, reconcile cohort tags across datasets and fix mismatches before choosing the final decision basis. If the cohort cannot be defended clearly, treat the benchmark as directional and do not use it alone to greenlight expansion.
This pairs well with our guide on Platform Economy Payment Index for Contractor Payments.
Define a minimum metric taxonomy that survives quarter-over-quarter#
Freeze a small, auditable taxonomy before you compare quarters. Use a full-funnel core plus compliance, tax, and backlog-stress metrics, with one accountable owner and a written definition for each metric.
A practical filter is simple. If a metric can move because reporting thresholds changed, sources changed, or denominators changed without documentation, do not use it alone to steer expansion decisions.
Keep the funnel complete#
Do not let headline payment success hide operational strain. Keep this minimum KPI set in every quarter: collection success, time-to-funds, payout success, return rate, exception rate, and reconciliation lag. Then track compliance and tax readiness plus backlog stress alongside the funnel.
| KPI | Why it matters for expansion | Decision it informs |
|---|---|---|
| Collection success | Tests pay-in reliability in the target market mix | Enter now or delay for better payment-method coverage |
| Time-to-funds | Shows settlement speed and cash-timing pressure | Can you meet seller timing expectations |
| Payout success | Confirms funds reach recipients at scale | Is the payout rail launch-ready |
| Return rate | Signals reversal and rework burden | Will this market add avoidable operating drag |
| Exception rate | Reveals manual handling outside the happy path | Do you need more ops capacity before launch |
| Reconciliation lag | Shows how fast transactions can be matched and closed | Can Finance support auditability in-market |
| KYC/AML verification pass rates | Indicates onboarding friction and control performance | Is onboarding workable without overloading review queues |
| W-8, W-9, and Form 1099 documentation completion | Shows tax-document capture readiness for the eligible population | Can you scale without later cleanup programs |
| IRS Form 1042-S filing readiness | Shows readiness for relevant non-US payee reporting | Is cross-border rollout operationally supportable |
| Unresolved payout exceptions and aging exposure | Exposes backlog stress that top-line rates can hide | Pause launch, add capacity, or fix root causes first |
Protect tax metrics from false trend breaks#
Tax trend lines can break for reporting reasons, not operational reasons. IRS research on platform gig work identifies a post-2016 "1099-K gap" in the described context. It includes lower-earning workers who no longer received an information return, and it notes that raw counts could understate platform work without correction.
That means tax-document readiness metrics should be tracked against the eligible population under that quarter's rule set. Record that rule set in the metric dictionary.
If rule changes affect the metric, verify against authoritative publication checkpoints. IRB 2026-5 describes threshold changes for when certain TPSOs must perform backup withholding, including the section 6050W(e) de minimis exception. IRB highlights are navigation aids, not authoritative interpretation. FederalRegister.gov is informational, so confirm against official editions or PDFs, including the govinfo-linked official PDF.
Write the dictionary before the close#
Write the metric dictionary before quarter close, not after. Require three fields for every KPI: formula, data source, and caveats. Without that, quarter-over-quarter comparisons drift.
Use caveats to log threshold-sensitive populations, exclusions, source migrations, and timestamp-definition changes. Apply the same discipline to unresolved payout exceptions and aging exposure so stable headline payout success does not hide a worsening exception backlog.
Related: Accounts Payable Aging Report for Platforms: How to Track Overdue Contractor Payments.
Add country readiness gates before market entry#
Set a hard tax-readiness gate before launch. If filing ownership is unclear, delay entry even when demand is strong. Use a short, auditable checklist focused on Form 8938 and related reporting decisions.
| Gate area | What to confirm before launch | Evidence to keep | Launch rule |
|---|---|---|---|
| Return-filing status | Whether the taxpayer is required to file an income tax return for the period in scope | Filing-status determination, owner, review date | If no income tax return is required, Form 8938 is not required; document and re-check when facts change |
| Form 8938 filing checkpoint | Form 8938 is attached to the annual return, due-date timing (including extensions) is mapped, and the applicable calendar year or tax year is specified | Filing calendar entry, year-mapping note, filing owner | Missing year mapping or owner means hold |
| Threshold and scope review | Threshold assumptions for the taxpayer type in scope are documented, including known exclusions (for example, accounts maintained by a U.S. payer) and any unresolved threshold questions | Threshold worksheet, entity classification note, open-issue log | Unknown threshold inputs without an owner means hold |
| Foreign-account reporting steps | Form 8938 and separate FinCEN Form 114 considerations are explicitly reviewed when relevant | Decision note, eligibility assumptions, review owner | Treating one filing as a substitute for the other means stop |
The dependency teams miss most often#
A common miss is treating Form 8938 like a policy footnote instead of an operational checkpoint. It must be attached to the annual return and filed by that return's due date, including extensions, and the filer must specify the applicable calendar year or tax year. Your gate should confirm both year mapping and retrieval ownership before launch.
For foreign-asset reporting steps, do not collapse obligations. Form 8938 reporting does not replace FinCEN Form 114 when that separate filing applies.
Use thresholds carefully, only where supported#
Thresholds can help, but only when you stay inside what the source actually supports. IRS materials cite an aggregate value above $50,000 for certain U.S. taxpayers, and Form 8938 instructions cite $50,000 at year end or $75,000 at any time during the tax year for certain specified domestic entities. Where higher thresholds may apply, mark unknowns clearly until the applicable rule set is confirmed.
| Reference | Figure | Context |
|---|---|---|
| IRS materials | above $50,000 | aggregate value for certain U.S. taxpayers |
| Form 8938 instructions | $50,000 at year end or $75,000 at any time during the tax year | for certain specified domestic entities |
| IRS platform-work research | less than $20,000 | many workers in the post-2016 1099-K gap no longer received an information return |
| IRS platform-work research | about 770,000 workers by 2018 | raw counts understated platform work by this amount |
Also account for reporting blind spots. IRS platform-work research describes a post-2016 1099-K gap in which many workers earning less than $20,000 no longer received an information return. It also says raw counts understated platform work by about 770,000 workers by 2018.
Tie tax readiness to operations, not policy alone#
Tax readiness has to live in operations, not just policy. Require named owners for return-filing determinations, Form 8938 threshold/year mapping, and separate FBAR review when applicable.
If you need one launch rule, use this one: strong demand does not override unclear tax-compliance ownership.
For a step-by-step walkthrough, see Spend Analysis for Platform Finance Teams to Categorize and Benchmark Vendor Payments.
Use payment-method mix to sequence expansion#
Once the country gate is cleared, sequence launches by payment-method fit and operating burden, not by payment-volume headlines. A market can look large and still be a poor launch if your likely collection and payout paths create stacked fees or extra operating complexity.
For this report, the practical question is not how many methods exist in theory. It is which country gives you enough method depth to operate cleanly with your current team. Broad availability alone is not enough. Stripe highlights 100+ payment methods, but that does not by itself confirm fit for your seller profile, buyer geographies, or finance operations.
Compare method paths by cost shape and operating load#
Use a side-by-side cost view before ranking markets.
| Method path | Grounded pricing signal | What to model operationally |
|---|---|---|
| Card-first | Stripe standard domestic card baseline: 2.9% + 30¢ | Exception handling and reconciliation effort |
| Bank transfer (ACH Direct Debit) | 0.8% with $5.00 cap | Return handling and mapping funds to internal records |
| Managed Payments local methods | 3.5% fee added to standard processing; in some cases 1.5% international + 1-2% FX conversion | Margin impact versus access to local methods not otherwise supported |
If you are modeling specific local methods under Managed Payments, such as ranges like 2.99%-5.99% in certain buyer-country cases, treat those as country-method inputs rather than global assumptions.
Treat country pricing as a hard checkpoint#
Country-level pricing is a hard checkpoint, not a cleanup step. Before scoring any market, verify country-level pricing. Stripe states that country payment-method pricing pages supersede generic Managed Payments fee tables. Save a snapshot and record, at minimum, the payment method, supported buyer geographies, variable pricing, and fixed fees.
This avoids a common sequencing error: ranking countries off a generic table and discovering late that local pricing or method availability is different. Because gateway costs can change, re-check before final sequencing decisions.
Model operating load before modeling growth#
Before you model growth, model the fee stack and operational burden. Compare card-first, bank-transfer, and Managed Payments paths using country-specific pricing inputs, including the standard processing layer plus any Managed Payments and cross-border add-on fees that apply.
For the full breakdown, read The Payment Operations Maturity Model: How to Benchmark Your Platform Finance Team.
Set do not launch yet triggers#
A market should stay out of the queue if you cannot show clear evidence for controls, definitions, and comparability checks. Keep this as a short hold list that is explicit and hard to waive.
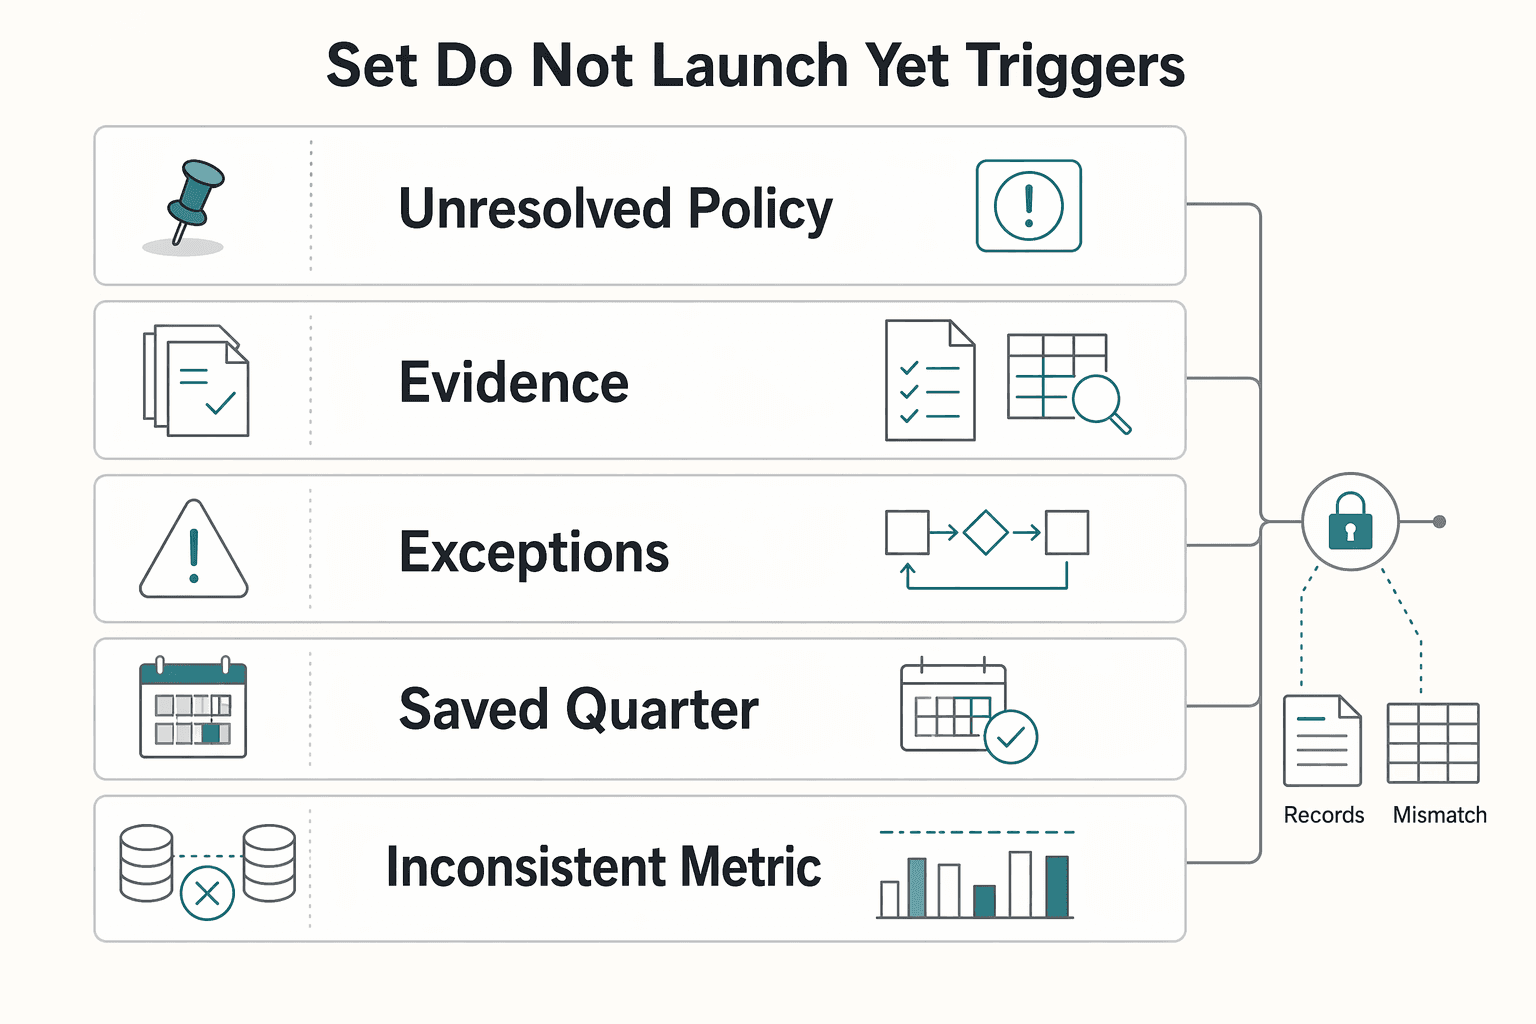
Use internal compliance and tax gates as hold triggers, but do not invent industry cutoffs you cannot support. Keep the market on hold if required policy questions are still unresolved in your process, if required tax-document capture is not reliably built into onboarding, or if payout exceptions are not being handled through a clear process. Document what must be fixed.
Apply the same standard to data quality and comparability. Keep a country on hold when KPI definitions changed mid-quarter, prior-quarter baselines are missing, or reconciliation gaps break the audit trail from collection through payout. Before any external benchmark affects launch timing, confirm that it documents methodology and sample details, and confirm that the metric time frame is clear.
Use a visible stop list as part of that review:
- unresolved policy items that affect launch readiness
- missing required tax-document capture in the live flow
- unresolved payout or reconciliation exception queues
- no saved quarter baseline for comparison
- inconsistent metric definitions across countries or quarters
- benchmark methodology, sample, or metric time frame is unclear
Watch the comparability trap. Results can look stronger because a cohort is more high-intent, because a report targets one period but uses older data for some calculations, or because a dataset reflects a different platform population than your own. Publish a clear "not launch-ready" status with dated blockers so holds stay defensible and pressure-based exceptions are less likely.
Before approving a new market, pressure-test your stop conditions against operational controls (policy gates and failure states) in the Gruv docs.
Build the quarterly evidence pack operators can audit#
If the benchmark is going to drive launch decisions, the evidence pack has to hold up when someone else re-checks it. A good pack lets another operator verify why a market stayed on hold or moved forward using dated records instead of interpretation.
Freeze the same artifact set every quarter#
Freeze the same artifact set every quarter so comparisons stay defensible: cohort definitions, KPI dictionary, raw exports, reconciliation snapshots, and a policy-change log. These are not legal requirements from the sources here, but they are a practical baseline for consistent quarter-over-quarter review.
Use a quick test. Pick one headline metric and trace it to the exact export, definition, and policy version used that quarter. If you cannot, treat the result as directional rather than decision-grade.
When policy changes are part of the explanation, keep dated primary references. For example, if you rely on Internal Revenue Bulletin 2024-31, retain the bulletin and any underlying item you used. IRS issue synopses are reader aids, not authoritative interpretations.
Keep traceability for the flows that hide errors#
Some flows hide errors until late in the cycle, so traceability matters most there. For exception-prone workflows, preserve record-level traceability in your internal systems. At minimum, keep a stable link between the internal record ID, external reference (if any), retry history, and final resolution state.
If that chain is incomplete, it becomes difficult to separate real improvement from timing effects or exception handling across periods. The goal is not more reporting volume; it is a reconstructable audit path.
Anchor compliance evidence in dated tax artifacts#
Compliance evidence should be anchored in dated tax artifacts, not summaries alone. Save the dated tax guidance and internal reporting rules that were in force during the quarter, and pair them with your internal completeness view.
If you need implementation detail, keep it in a companion note with resources like IRS Form 1042-S for Platform Operators: How to Report and Withhold on Foreign Contractor Payments.
This is also where reporting artifacts can distort the picture. IRS research describes a "1099-K gap" where many platform gig workers earning less than $20,000 no longer received an information return. It estimates that raw counts understated platform work by approximately 770,000 workers by 2018, and it notes that workers receiving an information return reported on average $420 more in self-employment profits.
Treat information-return coverage as an explicit caveat in cross-market comparisons. In the study context, platform workers were responsible for determining their own tax liability rather than being subject to withholding, so uneven reporting artifacts can distort apparent performance.
You might also find this useful: Subscription Benchmark Report for Platform Operators: Churn Trials Payment Declines and LTV.
Run a quarter close process that catches false positives#
Quarter close should act as a validation gate first. Apparent wins can come from baseline or reference issues rather than real operating change.
Start with the baseline before you trust the trend#
Trust the baseline before you trust the trend. Your first check is whether the reference baseline is complete enough to support comparison. In benchmark settings, results can shift materially after omissions in compiled references are found, so a trend break is not decision-grade until baseline quality is confirmed.
For any meaningful change, trace the metric to the exact comparison artifacts used and confirm the comparison set is stable. If that trace is incomplete, mark the result as provisional.
Run a formal comparison check before publication#
Before publication, run a formal comparison check against the compiled reference outputs for the same scope. This keeps quarter close anchored to reproducible evidence instead of interpretation. If the benchmark is meant to guide decisions, treat the result as publish-ready only when that comparison is documented and reviewable.
Review failure modes separately#
Do not collapse all misses into one bucket. When performance deteriorates, separate failure types. At minimum, distinguish reasoning errors from retrieval failures, because they point to different remediation paths. That separation helps target fixes and reduces the risk of overcorrecting strategy based on a mixed error bucket.
Keep durable comparison artifacts and test staying power#
The last step is to check durability. Publish quarter results with comparison artifacts that another operator can inspect later. Structured comparison tables are useful because they preserve how differences were evaluated across dimensions.
Before turning a quarter signal into a recommendation, add a sustainability check so you are not mistaking a short-lived or support-dependent result for a durable gain.
Avoid the benchmark mistakes that derail expansion#
External benchmarks are useful context, but they are not expansion proof unless the source matches your payout operating reality on audience, methodology, and scope.
| Mistake | Grounded example | Why it is limited |
|---|---|---|
| Treating broad reports as operator payout benchmarks | KPMG study surveyed 500 banking leaders and 500 retail executives | bank-and-retail scope rather than a marketplace payout benchmark |
| Importing ecommerce benchmarks without payout comparability checks | Visa 2025 merchant report covered 1,082 merchant professionals in 38 countries, fielded October to November of 2024, with many respondents above $50 million in annual eCommerce revenue | not automatically comparable to payout operations |
| Skipping methodology and sample checks | Confirm each source's survey methodology and sample details | required before applying external figures to payout planning |
| Hiding unknowns instead of recording them | BIS says payment data may require special pre-processing and reconciliation operations | benchmark reuse without caveats can distort decisions |
- Mistake 1: Treating broad reports as operator payout benchmarks
A broad source may be useful context, but you still need to verify what it actually benchmarks. For example, KPMG's payment modernization study surveyed 500 banking leaders and 500 retail executives, which makes it bank-and-retail scope rather than a marketplace payout benchmark.
- Mistake 2: Importing ecommerce benchmarks without payout comparability checks
Do not drop figures from adjacent ecommerce reports directly into expansion models without checking fit. Visa's 2025 merchant report covered 1,082 merchant professionals in 38 countries, fielded October to November of 2024, with many respondents above $50 million in annual eCommerce revenue. That can inform merchant-side patterns, but it is not automatically comparable to your payout operations.
- Mistake 3: Skipping methodology and sample checks
Before reusing any benchmark, confirm each source's survey methodology and sample details. Make this a required checkpoint before applying external figures to payout planning.
- Mistake 4: Hiding unknowns instead of recording them
If a source cannot be cleanly inspected for scope and sample, state that uncertainty in the quarter evidence pack. BIS is clear that payment data may require "special pre-processing and reconciliation operations," and even card-spending growth can be volatile, so benchmark reuse without caveats can distort decisions.
Conclusion and next quarter action plan#
Treat next quarter as a decision-quality exercise, not a report-expansion exercise. Run a recurring, cohort-disciplined benchmark where each KPI must support a clear internal decision. If a metric cannot change sequencing, remove it.
Quarterly reporting can show movement and ROI before year-end, but only if inputs remain comparable quarter over quarter. Start with one defensible baseline quarter: stable definitions, clear ownership, and an evidence pack another operator can reproduce and caveat correctly.
Start with a baseline quarter you can defend#
Begin with the vertical and country cohorts you can measure consistently, then freeze cohort rules for the quarter. Publish a baseline only when someone outside the original analysis can reproduce each KPI and explain its caveats. If they cannot, treat the baseline as directional rather than decision-grade.
Use quarter two to compare, not redesign#
Quarter two is for comparison, not redesign. Compare against the prior quarter using the same cohorts, formulas, and caveats. If those foundations changed, classify movement as directional and keep it out of sequencing decisions. Use peer benchmarks as interpretation support, not as a substitute for your own scorecard.
Build verification into the scorecard#
Build verification into the scorecard anywhere legal or regulatory-sensitive assumptions are involved. Record source status in the evidence pack. If a FederalRegister.gov page is used, note that it is not the official legal edition, add the linked official PDF on govinfo.gov, and capture whether the item is proposed or final. The 02/11/2026 CMS item is labeled a proposed rule, which is exactly the kind of status detail that should prevent overconfident conclusions.
Turn the benchmark into explicit next-quarter decisions#
By quarter close, each target market should end with one explicit recommendation and caveat set.
| Recommendation | Use when |
|---|---|
| Proceed | trend direction, evidence quality, and ownership are strong enough to justify the next step |
| Hold | opportunity may be real, but caveats or verification gaps remain |
| Defer | data completeness, baseline stability, or assumption verification is not yet defensible |
Used this way, a quarterly benchmark report stays narrow and reproducible, so teams can act without over-reading non-comparable inputs.
Related reading: Accounting and Bookkeeping Platform Payments: How to Pay CPAs and Bookkeepers at Scale.
When your quarterly scorecard points to a next step but coverage or rollout constraints are still unclear, use Contact Gruv to validate market fit and implementation path.
Frequently Asked Questions
What is a platform payments quarterly benchmark report?
There is no single canonical definition in the available guidance. In practice, teams can use a platform payments quarterly benchmark report as an internal comparison document that keeps definitions stable so quarter-over-quarter decisions are credible. Its purpose is decision support, not presentation. Treasury TIC guidance also shows that reporting cadence and benchmark categories can be separate, so treat benchmark design as an explicit operator choice rather than an assumed industry standard.
Which metrics should founders compare before entering a new country?
Compare only metrics you can define consistently for the same cohort across markets. If definitions, denominators, or caveats differ, treat the output as directional, not decision-grade. If you cannot explain how each metric is calculated and sourced, pause expansion decisions until you can.
How often should benchmark inputs and cohort definitions be refreshed?
No single mandated refresh frequency is established in the available guidance, so use a consistent cadence and avoid casually rewriting cohort definitions mid-cycle. Cohort analysis is valuable because it can reveal what aggregate metrics miss. Keep data quality and segmentation discipline tight, since messy data, poor segmentation, and misreading can invalidate conclusions.
What makes a benchmark practical instead of vanity reporting?
A benchmark is practical when a metric change triggers a clear operating decision. It becomes vanity reporting when numbers are presented without ownership, caveats, or a defined response. A practical test is whether you can state what changes if the same metric worsens next quarter.
How should payment-method mix affect expansion sequencing?
Treat payment-method mix as an execution-planning input, not as a headline metric on its own. No universal sequencing rule is established here, so rely on what your team can measure and compare consistently for that mix. Start with the scope you can monitor cleanly and expand only when your measurement remains comparable.
Can ecommerce app benchmarks be used for platform payout decisions?
They can be used as context, not as a substitute for your own cohort-based benchmarking. If the source population or method does not match your operating model, label it as directional. Final rollout decisions should rely on internally consistent definitions and data.
What unknowns should block a country launch decision?
Unknowns that undermine data trust should block launch decisions. In practice, unresolved data completeness, weak segmentation, or interpretation ambiguity are enough to stop a go or no-go call. If you cannot tell whether movement is real or measurement error, the benchmark is not ready for launch evidence.
Try a related tool
Researched and edited by the Gruv editorial team. Gruv builds cross-border billing, payouts, and finance-operations software for global businesses.
Sources
- armedservices.house.gov/uploadedfiles/h.r._3838_fy26_ndaa_as_reporte...trusted
- federalregister.gov/documents/2026/02/11/2026-02769/patient-prot...trusted
- federalregister.gov/documents/2024/07/09/2024-14004/gross-procee...trusted
- home.treasury.gov/data/treasury-international-capital-tic-syst...trusted
- irs.gov/pub/irs-soi/23rpevolutionofplatformgigwork.pdftrusted
- irs.gov/businesses/corporations/do-i-need-to-file-fo...trusted
- masshpc.gov/sites/default/files/2023-02/CHART_P2_Evaluat...trusted
- medicaid.gov/medicaid/quality-of-care/downloads/2023-eqr-...trusted
Educational content only. Not legal, tax, or financial advice.
Related Posts

The Freelance Payment Penalty: A Modeled Audit of Platform Fees, FX Spreads, and Payout Delays
The money rarely disappears through a single, easy-to-spot fee. The real loss is stacked. A marketplace takes its commission, a processor adds a charge for international cards, a bank or payment company converts the currency at a spread, a platform holds the funds before release, and a wire sheds a little to intermediaries on the way in. Each layer looks defensible on its own, but the worker feels the combined result as a smaller deposit and a later payday.

How to Respond to a Subpoena for Business Records
Move fast, but do not produce records on instinct. If you need to **respond to a subpoena for business records**, your immediate job is to control deadlines, preserve records, and make any later production defensible.

A US Expat's Guide to Investing in UCITS ETFs to Avoid PFIC Issues
The real problem is a two-system conflict. U.S. tax treatment can punish the wrong fund choice, while local product-access constraints can block the funds you want to buy in the first place. For **us expat ucits etfs**, the practical question is not "Which product is best?" It is "What can I access, report, and keep doing every year without guessing?" Use this four-part filter before any trade: