

Quick Answer
Choose an expense or cash-payment basis, bridge AP, processor and ledger differences, then classify company vendor costs. Keep seller principal and internal transfers separate, normalize supplier identities and compare periods on stable definitions. Assign an owner and action to each metric, and test tools with your real data.
How platform finance teams use spend analysis#
Spend analysis helps platform finance teams when it is treated as operating work, not just reporting. The job is to collect, cleanse, classify, and analyze spend data so vendor payment decisions are usable in governance and forecasting.
Define the job correctly#
Start with the procurement lens, but do not stop there. Procurement spend analysis is built for sourcing decisions, supplier management, and category strategy. Finance teams also need a budget-variance and cost-accounting view.
Treat spend analysis as an end-to-end process, not a dashboard output. Identify source systems, collect records, cleanse names and fields, group transactions, categorize them, and then analyze. If you skip those setup steps, the charts may look clean while the data underneath is inconsistent.
Define the reporting basis and reconcile its totals before benchmarking. AP invoices, expenses and cash payments will not always have equal totals: explain accruals, prepayments, taxes, unpaid invoices, credits and cutoff differences in a bridge. Do not force distinct views to match by dropping unmatched records.
Ask operator questions, not only procurement questions#
Use the same data, but ask the questions your team actually owns. Procurement and finance look at spend through different lenses, and platform finance often needs an operating view alongside sourcing.
In practice, that means reading vendor spend for decision impact, not just supplier labeling. A vendor may be one line in a procurement report but still matter very differently for finance operations and cost predictability.
Avoid category designs that stop at accounting labels. If a category view cannot support comparisons, explain month-over-month change, or show what needs tighter control, it is not ready to use.
Keep the first version decision-bound#
Build a first pass you can maintain before you expand scope. Organize spend into categories that support trend and performance comparison, then benchmark internally across business units, locations, or categories.
This guide follows that path: categorize vendor payments in a way finance can maintain, benchmark with month-to-month comparability, and add scope only when it improves decisions. When data is thin, narrow the slice, state the caveat, and keep the decision rule explicit.
Apply one consistent filter set to every category or benchmark. If your team cannot explain the action it should trigger, do not add it yet. The goal is not more reporting surface area. It is a smaller set of trusted views for control, renegotiation, and prioritization.
What to prepare before you start#
If you want the analysis to hold up under review, get the setup right before you start classifying data.
Pull a fixed analysis window#
Fix the period first, then classify. A trailing window of the last 12 completed months is a defensible baseline for trend comparison.
Pull inputs from multiple systems, not just the cleanest export. That can include ERP data, AP systems, e-procurement platforms, expense management systems, and invoice-related exports. Keep enough detail to revisit classification decisions later.
Lock the minimum fields before extraction#
Map each source to a common schema: source system and record ID, invoice/credit ID, legal supplier and rollup ID, invoice and payment dates, original amount/currency, tax amount, reporting-currency amount and rate basis, expense/account classification, payment state, and contract/owner fields. Keep invoice lines, payments and settlement events in separate linked tables where one invoice has several payments.
If your records already carry additional context fields, keep them for downstream decisions. The important part is consistency. Avoid ad hoc renaming or dropped columns between extracts.
Set ownership for definitions and changes#
Assign an owner for source mappings, taxonomy rules and approvals before the first extract. Record source systems, definitions, valid values, responsible approver and the effective date of each change.
Run verification checks before analysis#
Check completeness, duplicate imports, unique transaction identifiers and source totals before interpretation. Keep unresolved amounts visible with their coverage impact. A defect in one source should restrict the affected comparison; it need not stop an unrelated, fully reconciled slice.
Define your payment taxonomy around product reality#
Once the data prep is stable, define the taxonomy around how the product actually works. Start with the job each payment supports, then add a behavior lens so the categories stay usable in decisions.
Build the first layer around operational jobs#
Use a hierarchical taxonomy with a first layer your team can apply every month. For platform finance, this can mean operational jobs rather than pure accounting labels, for example: payout operations, compliance, FX/treasury, card/processing, tooling, support.
Use as many levels as the decisions require, often two to four in an internal design. Separate function from accounting treatment: a treasury service fee may be an expense, while principal transferred to a seller is a liability settlement. Taxonomy labels do not turn every payment into company spend.
Add a second dimension for spend behavior#
A functional taxonomy alone can be limiting. Add a second classification dimension for behavior so categories become more useful in budgeting and control decisions. Use pairs such as recurring vs usage-based, controllable vs committed, and strategic vs tail-end.
That keeps functional categories from carrying too much weight. If the same vendor set can be sorted by both function and behavior without rebuilding the buckets, the model is likely working.
Set one routing rule before classification starts#
Set one internal routing rule up front to reduce inconsistent tagging:
- If a payment supports customer money movement, classify by flow stage first.
- If it supports back-office overhead, classify by function first.
Flow-stage logic can be useful for payment-related costs because authorization and settlement are distinct stages in card operations. If one vendor spans multiple stages, split using line-level or contract detail where possible. If not, assign it to the dominant service and log the exception.
Write inclusion and exclusion rules for each category#
Taxonomy quality comes from written rules, not shared intuition. Document each category with clear inclusion and exclusion rules so different reviewers classify the same payment the same way. For each category, keep a short definition sheet with purpose, what is included, what is excluded, evidence fields, and example transactions.
For maverick spend, define it in policy terms: purchases outside approved suppliers, processes, or policies. For off-contract contractor payments, use your internal rule text rather than a vague label so reviewers can apply it consistently.
For a step-by-step walkthrough, see Real-Time Reporting Metrics Platform Finance Teams Can Actually Control.
Map data sources and build vendor-level rollups you can trust#
After taxonomy, supplier identity is the next place bad decisions start. Build KPIs from normalized supplier identity, not raw vendor names, because one supplier can show up under multiple names, IDs, and entities.
Normalize supplier identity before grouping spend#
Build vendor-level rollups from a controlled supplier key, not the display name in an export. A practical base is a compound vendor key that keeps the ERP vendor ID and, where available, site or entity detail so distinct supplier records stay distinct.
Use name cleanup to improve matching, but do not treat it as proof of identity. Duplicate checks often truncate legal suffixes like LLC, INC, and Incorporated, which helps catch naming variants, but rollups still need explicit duplicate decisions. When records share a taxpayer ID, decide whether to correct, inactivate, merge, or keep them separate when a valid parent-child relationship explains the match.
Before you benchmark, review your highest-spend vendors and confirm each has one rollup record with documented children, aliases, and source IDs. If a major supplier still appears in multiple rollups, fix that first.
Avoid over-merging. Parent and subsidiary entities can legitimately share tax identifiers or branding, so do not collapse records on name similarity alone. Keep evidence for non-obvious merge or split decisions, such as supplier master records, contract entity names, tax ID checks, and invoice headers.
Reconcile key views before trusting totals#
Bridge processor, AP and ledger views by entity, currency, reporting basis and cutoff. A processor settlement is net cash activity that can include collections, refunds, fees and seller funds; it is not the same as supplier expense. An AP record can contain unpaid invoices and taxes that never appear in the same month’s payment export.
| View | Used to confirm |
|---|---|
| Processor export | Actual processing, transfer and settlement activity; distinguish platform costs from customer/seller principal |
| Payout reconciliation report | Bank-received payouts matched to transaction batches, if available |
| ERP or AP data | Supplier invoice/credit obligations, coding, tax and unpaid items |
| General-ledger and subledger views | Account balances and classification treatment |
Use bank and processor records for actual money movements, AP invoice/credit lines for purchase obligations, and expense/ledger accounts for recognized cost. Stripe’s automatic-payout reconciliation can link bank payouts to settlement batches; manual and instant payouts need a different reconciliation approach. Keep the bank movement as a settlement record rather than counting both the underlying invoice and its payment as spend.
Reconcile each balance on its own basis. Suppose the month contains €12,000 of supplier services, all recognized as expense, plus €2,400 recoverable VAT. Of the €14,400 gross invoices, €9,600 is paid and €4,800 remains payable. You also pay €1,200 for a prior-month invoice. Current-month vendor cash outflow is therefore €10,800, while current-month expense is €12,000: cash includes tax and an older liability, and excludes current unpaid invoices. This example assumes no other credits, accruals or prepayments. A pending payment is not an additional posted debit. Keep any seller funds paid through the platform in a separate liability reconciliation rather than adding that principal to company vendor costs.
Keep an exceptions log that stays visible#
Rollups are only trustworthy when defects stay visible. Maintain an exceptions log for missing metadata, manual overrides, unmatched records, and unresolved duplicate questions, with clear owners and action paths.
At minimum, log:
- exception type
- source view affected
- vendor name and source ID
- amount and period
- owner
- resolution status
- reason for manual override or non-match
Do not bury exceptions in an "other" bucket or silently rewrite them in a spreadsheet. If you remap a vendor because processor and AP views conflict, record who approved it and why. That makes recurring issues faster to resolve and keeps KPI reporting from hiding data quality debt.
For card authorization rules and policy ownership, see How to Build a Spend Control Policy for Virtual Cards on Your Platform.
Segment strategic spend versus tail-end spend before benchmarking#
Before you benchmark anything, split vendor spend into three lanes: strategic concentration, tail-end spend, and unmanaged or off-contract spend. If you skip this step, concentration risk, low-value noise, and policy leakage get mixed together and can push you toward the wrong fix.
Define your strategic and tail cut rules first#
Document your cut rules before you compare months. A common reference point for tail spend is 10% to 20% of spend spread across 80% of suppliers. Another pattern in practice is a high transaction count representing a smaller share of dollars. These are reference shapes, not universal thresholds.
For strategic spend, use supplier concentration and business impact: how much you spend with each supplier, and whether that concentration is intentional.
Build one supplier-category view with share of total spend, transaction count, owner team, and contract status. If your tail bucket still includes suppliers with meaningful operational dependence, refine the cut rules.
Use risk to set control intensity, not volume alone#
Low volume does not always mean low risk. Use risk, relationship context, and category impact as the control signal, then treat volume as supporting context.
Payment-critical vendors can warrant review even at modest spend. The 2023 U.S. interagency third-party guidance is directed to supervised banking organizations; its risk-based design can inform your own vendor process, but it is not a universal regulatory duty for every platform. Set controls for the vendor’s access, service dependence and contractual role.
For future purchasing, add approved intake and payment instructions where policy allows. Keep an exception workflow for obligations already incurred: missing procurement metadata does not by itself authorize withholding earned contractor funds or a legally due supplier payment.
Split contractor payments from off-contract contractor payments#
If contractor payments are material in your spend mix, do not let them disappear into a general services bucket. Track them in a dedicated lane, then split them into planned contractor spend and off-contract contractor payments. This is where maverick spend becomes visible: purchases made outside approved buying channels or contracts.
Use the split to diagnose the problem:
- planned contractor spend: pricing, routing, consolidation, or supplier mix issue
- off-contract contractor spend: intake, approval, or policy-bypass issue
Track fields like:
- contract status
- approved vendor or not
- requester or budget owner
- payment purpose
- exception reason
- onboarding status
Sample the highest-dollar off-contract contractor payments and check for contract or SOW reference, approval trail, invoice header, and onboarding record. If key evidence is missing, treat it as unmanaged spend until resolved.
Choose fixes by segment, not one policy for all spend#
Use the segment to match the intervention to the failure mode. Strategic concentration often needs concentration review, negotiation, and third-party oversight. Tail-end spend often needs better buying channels, tighter supplier-entry controls, or Tail-End Spend Management: How Platforms Can Automate Long-Tail Contractor Payments. Off-contract contractor spend often needs intake and approval controls before payment starts.
| Spend segment | Typical fix |
|---|---|
| Strategic concentration | Concentration review, negotiation, and third-party oversight |
| Tail-end spend | Better buying channels and tighter supplier-entry controls |
| Off-contract contractor spend | Intake and approval controls before payment starts |
If teams are ignoring an established policy, tighten enforcement and exception review. If the same exception keeps repeating because the approved path is too slow or mismatched to real work, change the process design rather than adding more policy text.
Compare wider payment-market context in State of Platform Payments Benchmark Report for B2B Marketplace Expansion, checking the report’s population and definitions before using any figure as a target.
Build a benchmark baseline that is comparable month to month#
After you define your spend slices, lock comparability before you start reading deltas. Build the internal baseline first, then use external references when definitions, period logic, and coverage are stable.
Set the internal baseline before peer comparisons#
A defensible benchmarking sequence is internal first, external second. Set one fixed baseline view and freeze the measurement rules behind it so month-to-month changes are interpretable.
Use one consistent category taxonomy, one consistent measurement method, and one defined period view. A practical pattern is completed month plus matching year-to-date, because unmatched periods reduce comparability.
Rerun the same baseline and confirm you get the same result. If headline metrics change on rerun, resolve taxonomy changes, method changes, or late-data handling before publishing trends.
If you use peer data, keep it as a secondary check. Comparisons become hard to read when definitions or operating models do not line up.
Keep the comparison slice constant#
Only compare slices built on the same rules: category definitions, period length, currency treatment, and coverage scope.
For a constant-currency comparison, freeze a reporting rate and apply it to both periods; retain actual booked rates in the accounting records. A €1,000 service translated at $1.10 in one month and $1.20 in another appears to rise from $1,100 to $1,200 without any supplier price change. Translating both at $1.10 removes that $100 reporting difference. Match year-to-date periods and disclose the chosen rate.
Keep a compact evidence pack for each monthly cut:
- taxonomy version
- metric-construction method
- currency method
- included entities, markets, and programs
- known exclusions or late-arriving data
If construction changed, flag it before interpretation. If the change is material, recast prior periods to the current presentation.
Track a small benchmark family set#
Keep the benchmark set small enough that cost and process signals can be read together.
| Benchmark family | Keep fixed month to month | Caveat to show in-table |
|---|---|---|
| Cost effectiveness | Same cost definitions, scope, and period basis | Included entities/programs |
| Cycle time | Same process start/end timestamps | Where timestamps are partial |
| Process efficiency | Same process definitions and denominators | Excluded scope or late data |
| Staff productivity | Same role/scope definitions and period basis | Coverage differences across teams/programs |
Cycle time is useful even in spend-focused reviews because benchmark sets often track it alongside cost and efficiency metrics. Pair one cost metric with one process metric so gains are interpreted in context.
Publish caveats where readers see the numbers#
Put caveats in the table next to each metric, not in a note far away. Coverage is usually the biggest comparability risk. When markets, entities, programs, or controls differ across periods, deltas can mislead.
Show at least: as-of date, baseline period, scope included, currency method, and whether prior periods were recast.
A common failure mode is false improvement after reclassification or new capture logic. When that happens, pause interpretation, recast where needed, and republish with a plain-English change note.
Related: Employer Cost by Country Benchmark for Finance and Ops Teams.
Choose KPIs that trigger decisions instead of dashboard noise#
Keep the KPI set tightly tied to action. Each KPI should have one accountable owner, clear threshold bands, and one required review cadence.
Assign an owner, an action, and a cadence#
For every metric, name one accountable owner, define the action when it crosses a band, and set the review rhythm. If several teams use the metric, appoint one owner to resolve conflicting decisions. For concentration, specify whether the share is vendor expense divided by total in-scope expense or payout flow divided by total payout flow; those measures answer different questions.
Keep the pack small and priority-led. A practical starting point is about 3 to 4 priority goals so review time stays on action, not explanation.
Set internal review frequency to the decision: monthly close checks, weekly high-volume exception review and periodic strategic supplier review can serve different needs. Record the chosen cadence and trigger, rather than applying a universal quarterly requirement.
Before a KPI goes live, answer in one line: who acts, what changes at each band, and when the next required review happens.
Write the if-then rule before the metric moves#
Thresholds only work when the response is agreed in advance. Write the if-then rule now so decisions are not improvised after results arrive.
Use internal trigger bands for concentration exposure and explicit exposure limits, and tie them to documented actions. Concentration risk management is about identifying and analyzing concentrated exposures, so reporting by itself is not enough.
| KPI pair | Internal trigger design | Owner action |
|---|---|---|
| Vendor concentration + payment exception rate | Green/amber/red bands based on your fixed baseline and scope | If both worsen together, trigger a documented risk-and-controls review before expansion decisions |
| Unit cost or fee per payment + policy breaches | Bands set on a like-for-like monthly or YTD view | Show the measured cost change and control deterioration separately; do not attribute savings to the breaches without evidence. |
| Cycle time + manual override rate | Bands based on the same timestamps and coverage each period | If cycle time drops only because overrides rise, review process design before scaling volume |
Pair performance KPIs with control KPIs#
Performance indicators alone are not enough. Pair performance KPIs with control KPIs so cost or speed gains are not coming from control erosion.
Define the numerator and denominator before pairing metrics. If provider fees are $500 for 2,000 successfully completed payouts, fee per payout is $0.25. A later $660 for 3,000 comparable payouts produces $0.22: unit cost falls 12%, while total fees rise 32% and completed volume rises 50%. That is not a reduction in total spend. State whether retries, failed-payment charges and fixed fees are included, keep the completion cohort consistent, and review the accompanying exception rate.
Use more than one type of evidence in the review: the metric trend plus exception logs, scope changes, and a short control-gap note. That makes it easier to separate real improvement from measurement artifacts.
Retire metrics that do not change behavior#
Retire or demote metrics that do not drive procurement decisions, product scope changes, or treasury workflows. A metric can be interesting and still be dashboard noise if it has no owner action or threshold consequence.
Keep a compact KPI register with definition, source, owner, threshold bands, review date, and retirement reason. That preserves an audit trail and keeps low-value measures from quietly returning.
Decide when spreadsheets break and software is worth it#
Repeated joins and recoding justify a control and tooling review. First determine whether the cause is missing source identifiers, undocumented rules or a tool limitation. Buying software does not repair an undefined taxonomy, and a reproducible spreadsheet model may remain suitable while those controls hold.
Score the breakpoints in your current process#
Excel’s worksheet limit is 1,048,576 rows by 16,384 columns. Google’s current Drive help lists up to 20 million cells or 100MB for spreadsheets created in or converted to Sheets. Those are format limits, not recommended operating thresholds. A controlled spreadsheet process can work below them, while a smaller model can fail through weak joins, access or change tracking.
Use one reproducibility test: can a second owner rebuild last month's category mix, vendor-level rollups, and exception counts from source exports without side notes? If not, the process is person-dependent, not control-ready.
Primary break signals:
- The same vendors or payment purposes are reclassified every month because taxonomy rules are not enforced at source.
- Close and benchmark views rely on copy-and-paste joins, ad hoc overrides, and no durable exception log.
Build a decision matrix before comparing vendors#
Start with operating requirements, then score tools against them. Taxonomy quality is a prerequisite for meaningful categorization, so weak category foundations should be treated as a data-model-fit risk before selection.
Use the six evaluation rows below as the purchase criteria. Test each with one real prior-month dataset: reproduce the same supplier totals, classification exceptions and period comparisons, then inspect how an operator corrects an alias or rule. A product demonstration is useful only if that correction remains traceable and the totals still reconcile.
| Evaluation area | What to verify | Ownership and migration constraint | Red flag |
|---|---|---|---|
| Category taxonomy controls | Supports maintainable hierarchy and rule changes, often 3 to 4 levels deep where needed | Finance or procurement owns definitions; process-validation ownership is explicit | Category logic only works in demos, not in your real structure |
| Vendor-level rollups | Handles aliases, parent-child entities, and duplicate IDs with traceability | Define who owns vendor master logic after go-live | Rollups still require off-tool cleanup every close |
| Benchmarking comparability | Enforces like-for-like definitions, scope, and peer grouping | Approve benchmark definitions before external comparison is used | Benchmarks shown without normalization assumptions |
| Auditability | Preserves change history for reclassifications, approvals, and exceptions | Prioritize this more when ICFR reporting obligations apply | No clear audit trail for category or approval changes |
| Workflow integration | Fits current ERP/AP/ledger flows and reconciliation process | ERP/IT owns technical integration; Finance/procurement validates process behavior | Works in demo but breaks in production data flow |
| Migration constraints | Covers in-flight requests/open POs and cutover handling | Assign technical integration ownership and process-validation ownership before cutover | In-flight activity is ignored, causing incomplete or miscoded transactions |
Compare tools on fit and control behavior, not labels#
When evaluating Coupa, Order.co, Sievo, Ramp, or similar options, score them against three testable criteria: data-model fit, exception handling, and implementation overhead.
- Data-model fit: Can the tool classify your real payment patterns and keep rollups stable across months?
- Exception handling: Can you set thresholds, route alerts, and resolve exceptions with visible ownership?
- Implementation overhead: Can your team adopt it without breaking close discipline during migration?
Use the real-data test to choose between fixing source/process controls and buying software. Add software when it demonstrably reduces recurring work or error and preserves reproducibility, rather than treating every manual join as an automatic purchase trigger.
Related reading: Partial Payments and Milestone Billing: How to Implement Flexible Invoice Terms on Your Platform.
If your decision matrix says manual joins are now a risk, review the operational patterns in Gruv Docs before locking software scope.
Set ownership and operating cadence across finance and product#
Once the process is in place, make it control-ready. That means clear owners, dated decisions, and a visible change history. Set the review cadence to match the decisions you need to make. If your team closes monthly, a monthly cycle can be a practical fit.
Assign decision owners by root cause, not report ownership#
Assign ownership where the fix actually sits. For example, finance can own taxonomy quality, benchmark preparation, and first-pass exception review; product can own issues tied to product behavior, routing logic, or missing operational metadata; and procurement can own issues tied to vendor policy, contract scope, or off-contract buying. For each standing review item, document an accountable owner, any delegated contributors, and a target date.
Run one recurring review with three fixed outputs#
Keep the review tied to taxonomy changes, benchmark comparability and open actions. End with a dated decision such as consolidating a vendor, recasting a category, correcting a payment-control defect or routing a sourcing issue to procurement.
Before publishing benchmark deltas, confirm that definitions are comparable across periods, including factors like category definitions, period scope, currency treatment, and vendor rollups. If comparability changed, label that break clearly.
Escalate unresolved exceptions with explicit due dates#
Escalate unresolved exceptions to the owner who can fix them, with the affected amount, reporting impact, requested action and target date. Leadership should see repeated carryovers and the reason for each. If a regulated or contractual reporting regime applies, add its specific requirements rather than borrowing a federal-agency corrective-action rule.
Keep a taxonomy change log#
Without a change log, benchmark movement becomes hard to interpret. Keep a taxonomy change log with effective date, old rule, new rule, approver, and whether prior periods were restated. That record helps separate real spend shifts from reclassification-driven comparability breaks.
Common failure modes and how to recover fast#
Spend-analysis failures do not always call for a full rebuild. Start with containment, document what changed, and restore comparability as quickly as you can.
Temporarily limit category growth when taxonomy starts to sprawl#
Pause near-duplicate new categories for one cycle. Keep ambiguous items in a visible unresolved-classification lane instead of forcing a confident assignment. Resolve them against contract or invoice evidence, then update the rule and recast affected comparisons.
Benchmarking is most dependable when definitions and processes are standardized, and consistent categorization improves visibility and comparability. A practical check is to review recent newly tagged payments against your written inclusion and exclusion rules. Repeated labels such as "other tools," "misc ops," or team-specific categories can point to loose rules or weak enforcement.
Record the recovery in your change log with the effective date, old mapping, new mapping, approver, and whether prior periods will be recast.
Recast history when benchmark swings are really reclassification#
If a month-over-month swing came from reclassification, recast prior periods to the current presentation before publishing trend conclusions. Comparability over time is an explicit objective, and methodology changes can require prior-period recasting.
Apply one current classification logic across the periods you compare, and clearly label any comparability break if full recasting is not possible. Then verify that revised prior periods still tie to source totals. If totals move unexpectedly, you may have a deeper rollup, duplicate-vendor, or source-reconciliation issue.
Add intake and post-payment checks to surface hidden off-contract contractor payments#
Hidden off-contract contractor payments can indicate a control-design gap, not just a procurement cleanup issue. Add checks at request intake and a post-payment exception review.
At intake, collect the intended vendor, relevant contract or order reference, owner and payment purpose. After payment, review missing identifiers or approvals against the underlying records before declaring a breach. Track confirmed off-contract purchases, missing metadata and approved exceptions separately; multiplying an external leakage percentage by your spend is not measured recoverable savings.
Track exceptions so you can separate true policy breaches from missing metadata. For a deeper operating pattern, see Maverick Spend in Platforms: How to Stop Off-Contract Contractor Payments Before They Drain Margin.
Rerun tool selection against actual operator pain before buying more software#
Tool overbuy can happen when demos outrun requirements. If a product cannot handle your taxonomy, exception flow, audit trail, and vendor rollup or reporting needs, hold scope.
Poorly defined requirements are a common source of project difficulty, and acquisition guidance emphasizes identifying needs and trade-offs before purchase. Re-run the decision matrix against current close and review pain points: recurring manual joins, repeated reclassification, missing auditability, and weak exception routing. Final check: can the shortlist solve at least one live problem with your real data, not sample dashboards?
30-60-90 day execution plan for platform teams#
Use the first 90 days to prove data accuracy and decision quality before you expand tooling. If totals do not reconcile or classifications are still changing, pause benchmarking and rollout decisions until the foundation is stable.
| Phase | Primary focus | Checkpoint |
|---|---|---|
| Days 1-30 | Lock definitions and publish a clean baseline | Reporting-basis bridge reconciles; classifications consistent; unmatched and unresolved amounts have owners |
| Days 31-60 | Run the first benchmark cycle and act on validated opportunities | Material benchmark deltas are explained and documented; reconciliation exceptions are reviewed and resolved on a recurring cadence; owner decisions for selected actions are recorded |
| Days 61-90 | Decide software scope and launch the minimum viable controls | Reconciled totals still hold after rollout changes; classification mappings stay consistent for period-over-period comparison; reconciliation controls continue on at least a monthly cadence; scope decisions and explicit deferrals are documented |
Carry forward the same recovery discipline from the previous section: end each phase with a checkpoint, document what changed, and only then move on. This is a practical sequence, not a deadline you should force when readiness is missing.
Lock definitions and publish a clean baseline in days 1-30#
The goal in this phase is a reliable baseline, not better dashboards. Keep taxonomy definitions stable within the baseline cycle. Clean vendor-level rollups against raw transactions, and build baseline KPIs from transactional data so duplicate vendors and mapping errors stay visible before aggregation.
Inventory all internal and external spend sources, then tie together payment-system exports, ERP or AP exports, and finance's ledger-linked view. Keep the KPI set small and decision-focused: vendor concentration, category mix, and exception count. A quick concentration cut like "Top 10 vendors by purchase" can surface supplier concentration fast.
Use reconciliation as the gate. Before publishing the baseline, confirm:
- Source totals and the reporting-basis bridge reconcile; unresolved differences and their affected scope are visible.
- Category assignments are consistent under current mappings.
- Unmatched records are logged and tracked as exceptions.
If totals still drift, fix the mapping first and delay baseline publication.
Run the first benchmark cycle and act on validated opportunities in days 31-60#
Run benchmarking only after the baseline is stable. Keep comparisons like-for-like by using consistent taxonomy, period treatment, and vendor rollups, then validate material deltas before turning them into actions.
Start with year-over-year views by vendor group and category. Treat large moves as untrusted until you rule out reclassification, rollup changes, or source-format differences.
Take a small set of high-confidence actions tied to validated deltas, focusing first on categories or vendor groups with the clearest confirmed variance.
Phase checkpoint:
- Material benchmark deltas are explained and documented.
- Reconciliation exceptions are reviewed and resolved on a recurring cadence (at least monthly).
- Owner decisions for selected actions are recorded.
If the trend breaks when prior periods are recast under current mappings, stop and fix comparability before proceeding.
Decide software scope and launch the minimum viable controls in days 61-90#
Decide software scope only after you trust the data and the benchmark signals. Re-run the decision matrix against live pain points: taxonomy control, vendor-level rollups, benchmarking depth, auditability, exception handling, and manual close-time joins.
If delay and error are still driven by manual joins and repeated reclassification, software-backed controls may be justified. If the main issue is still weak categorization or vendor normalization, tighten process discipline first and retest after another stable cycle.
Launch only the minimum feature set needed to solve proven problems, typically classification controls, rollup management, exception tracking, and auditable KPI output. Defer broader scope until the new setup reproduces current totals and preserves baseline comparability.
Final checkpoint:
- Reconciled totals still hold after rollout changes.
- Classification mappings stay consistent for period-over-period comparison.
- Reconciliation controls continue on at least a monthly cadence.
- Scope decisions and explicit deferrals are documented.
If any of these fail, reduce scope and rerun the phase instead of scaling an unreliable setup.
Turn this into a weekly operating habit#
Run this as a weekly control review, not a reporting ritual. If one of the first three checks fails, stop there and fix data trust before debating benchmark movement or tools.
Set the review up as a control, not a status call#
Assign a finance owner and a procurement or product counterpart to maintain the checklist and close actions. Keep the cadence proportionate to change volume and exception risk. The GAO Green Book addresses government internal controls and can supply a monitoring reference; your weekly meeting is an internal operating choice, not a federal mandate on all platforms.
Keep one shared document with a visible update date, named owners, and a short change log. Before the meeting starts, confirm everyone is using the same payment exports and the same taxonomy version so you do not create false exceptions.
Use the checklist in the same order every time#
Copy and paste this as your standing agenda:
- Taxonomy definitions are current and shared with finance and procurement.
- Vendor-level rollups reconcile across source exports and platform records.
- Benchmarking uses like-for-like slices and documented caveats.
- Each KPI has an owner, trigger rule, and dated action.
- Tail-end spend management and off-contract purchases have active exception tracking.
- The tool-evaluation decision matrix is updated before any spend analysis software purchase.
- The next review meeting has one clear decision tied to vendor payments and operating cost.
Review the checks with operator rules#
Start with taxonomy. If definitions changed, confirm inclusions, exclusions, and examples were shared, not just relabeled. A reference taxonomy such as UNSPSC can reduce drift, but local definitions still need to match how your platform pays vendors.
Move next to reconciliation. Reconciliation compares record sets for accuracy and consistency, so the checkpoint is whether totals and unmatched records are explained. If vendor rollups do not tie across records, do not trust concentration KPIs or supplier benchmarks yet.
Then review benchmarking and KPIs together. Benchmark movement is only meaningful when slices are comparable, so check category structure, period treatment, currency treatment, and vendor rollups first. Where comparability is weak, document caveats directly next to the number. For KPIs, require an owner, a trigger rule, and a dated action. If a metric has no action path, remove it from the meeting.
Track exceptions and buying decisions with evidence#
Use an explicit local definition for tail-end spend because thresholds vary by organization. The 10% to 20% of spend across 80% of suppliers framing is a reference point, not a rule. For off-contract spend, keep an exception log with vendor, category, requester or owner, missing contract reference, and due date. Review the trend of purchases made without contract assignment when your process supports that measure.
Keep the tool-evaluation decision matrix current before any software purchase. Use defined criteria and weightings, and update them based on recurring pain points such as repeated reclassification, poor auditability, or exception handling gaps. If the matrix is stale, pause the buying discussion and refresh it first.
The meeting is successful when it ends with one dated decision tied to vendor payments and operating cost, not just a fuller dashboard.
Once your 30-60-90 plan is drafted, talk to Gruv to confirm market/program coverage and implementation constraints for your payout and treasury workflows.
Frequently Asked Questions
How should platform finance teams categorize vendor payments without creating category bloat?
Use a hierarchical taxonomy so you can roll spend up or down without creating endless flat labels. Keep definitions explicit so different reviewers classify the same payment the same way. UNSPSC is a useful reference model for hierarchy, but it should not be forced as the only structure for platform-specific payment flows.
What should we benchmark first when we start vendor spend analysis?
When external comparisons are limited, start with internal like-for-like benchmarking. Keep definitions, coverage, and reporting practices consistent before interpreting deltas. If source data is weak on accuracy, completeness, or applicability, fix reliability before treating differences as meaningful.
Which key performance indicators (KPIs) are most useful for platform payment operations?
Use a mix of KPI families instead of a single cost metric. A practical starting set includes process cost, supplier lead time, and electronic PO approval rate where that approval flow exists, plus exception and control metrics tied to day-to-day operations. Keep each KPI tied to a clear owner and action so the metrics drive decisions.
How do we compare benchmarks when external data for B2B marketplace operators is thin?
Treat external benchmarks as directional context, not proof. Comparability depends on reporting practices, including definitions, coverage, and exclusions, so document those limits next to each comparison. When external data is opaque, rely on a stable internal baseline and normalize peer comparisons carefully.
When should we move from spreadsheets to spend analysis software?
There is no universal threshold, so make this an evidence-based decision. Move when manual tracking starts degrading data reliability (accuracy, completeness, or applicability) and weakening monitoring controls. Recurring reconciliation failures and a growing exception backlog can indicate that software-backed controls are justified.
How do we catch maverick spend and off-contract contractor payments early?
Use intake and payment checks across the relevant spend base, then prioritize by value, recurrence and risk. Separate a confirmed policy breach from a missing contract field or permitted exception. Assign an owner to resolve the evidence and strengthen future buying controls; already-due contractor earnings are not automatically optional because a procurement record is incomplete.
How often should finance teams and procurement review category taxonomy changes?
Use ongoing monitoring plus periodic separate evaluations, rather than a fixed universal cadence. Log exceptions and edge cases continuously, then run formal reviews at intervals that match your change volume and operational risk. If one area keeps requesting new categories, tighten definitions before expanding the taxonomy.
Try a related tool
Researched and edited by the Gruv editorial team. Gruv builds cross-border billing, payouts, and finance-operations software for global businesses.
Sources
Includes 3 external sources outside the trusted-domain allowlist.
- docs.stripe.com/reports/payout-reconciliationtrusted
- docs.stripe.com/api/balance_transactions/objecttrusted
- fdic.gov/news/financial-institution-letters/2023/fil2...trusted
- gao.gov/greenbooktrusted
- cips-download.cips.org/dont-manage-tail-spend-eliminate-itexternal
- support.google.com/drive/answer/37603external
- support.microsoft.com/en-us/excel/excel-specifications-and-limitsexternal
Educational content only. Not legal, tax, or financial advice.
Related Posts
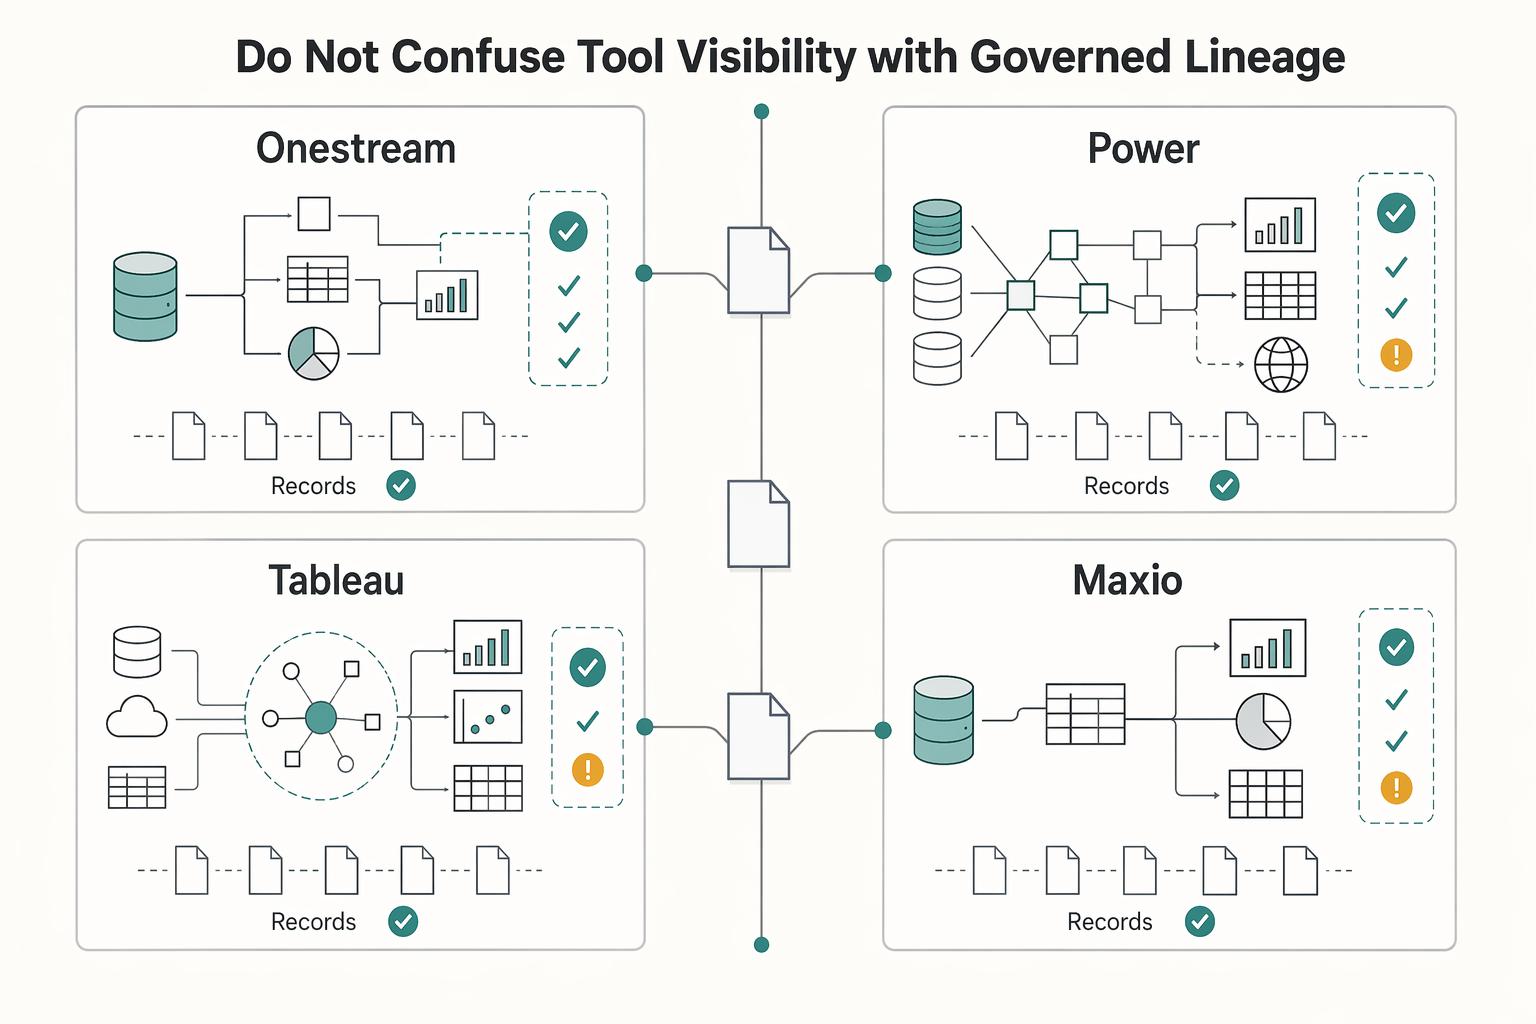
Real-Time Reporting Metrics Platform Finance Teams Can Actually Control
Treat real-time reporting as an internal control problem, not a dashboard shopping project. For platform finance teams, the goal is timely control over reporting quality and payment operations. You need issues detected, routed, and acted on before they turn into misstatements or payment errors.
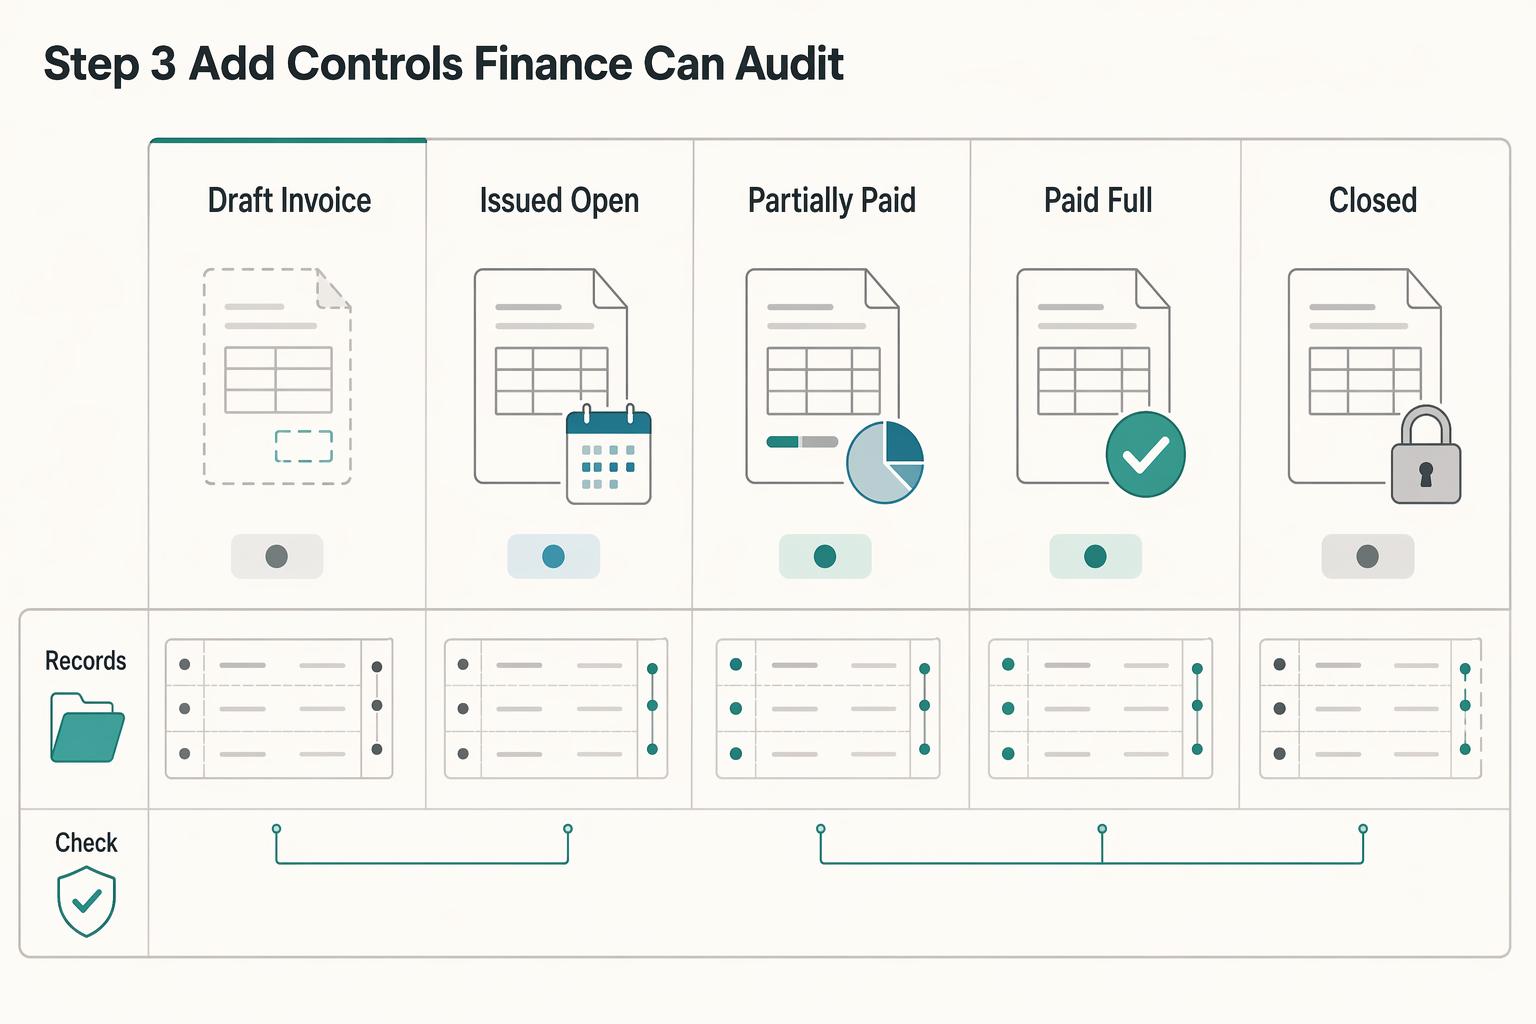
Partial Payments and Milestone Billing: How to Implement Flexible Invoice Terms on Your Platform
Milestone billing is most reliable when each invoice is tied to a defined project checkpoint, a clear completion signal, and a billable amount. Without that chain, there is no clear link between progress and billing.
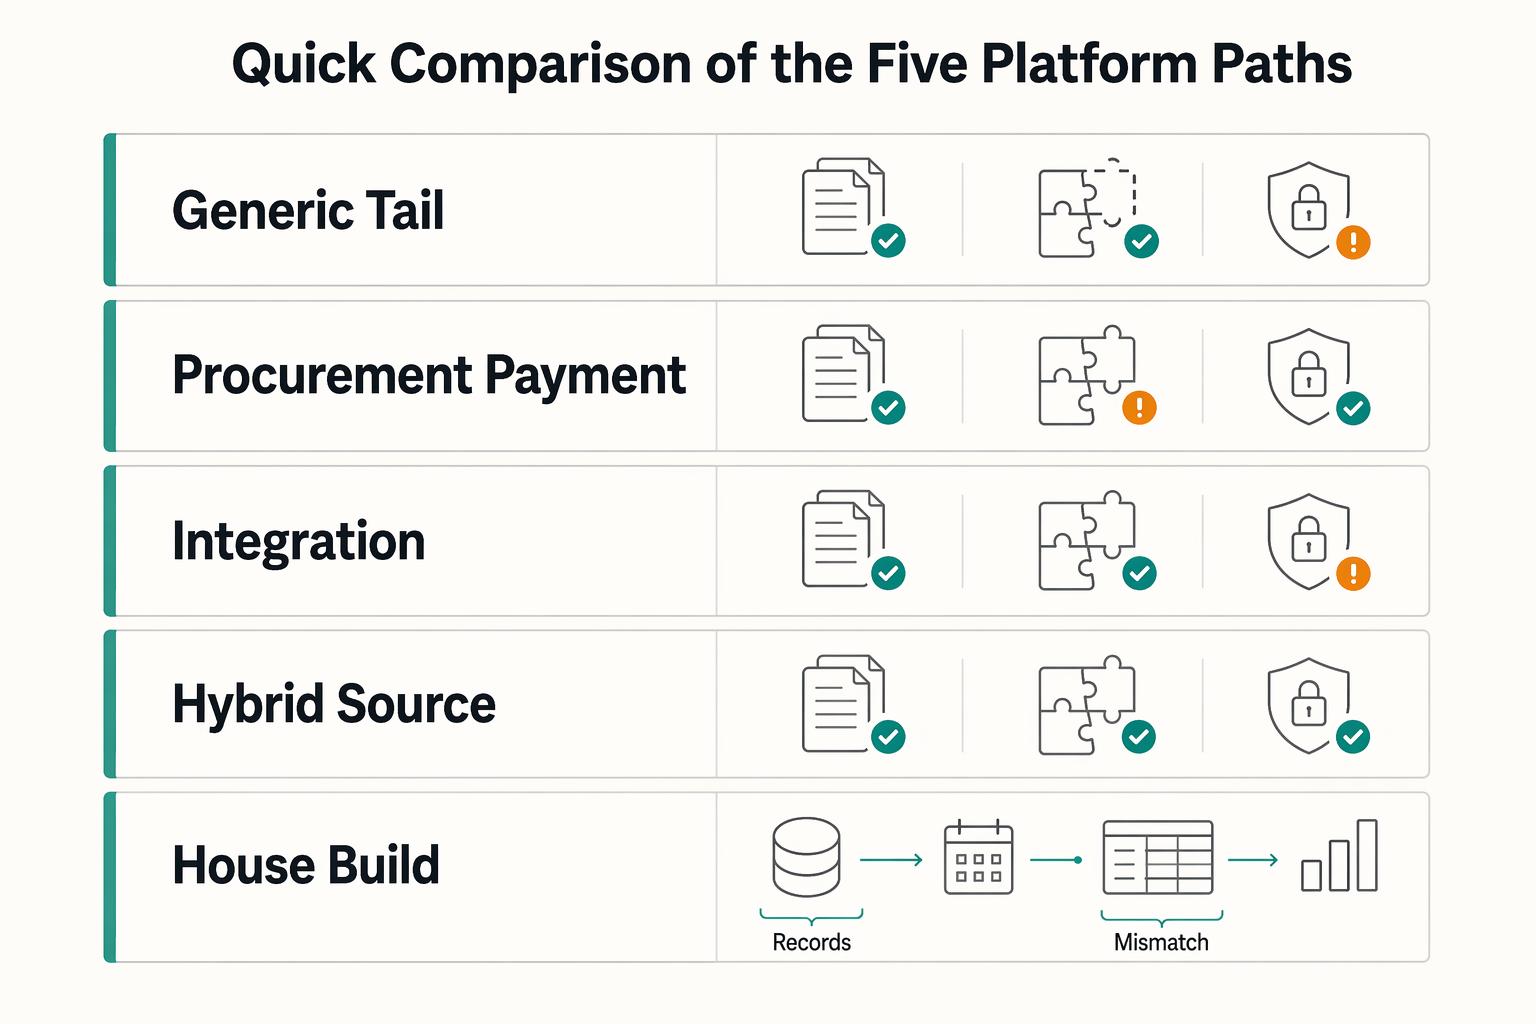
Choosing a Tail-End Spend Management Platform for Long-Tail Contractor Payments
Tail-end spend management can start to break down when long-tail contractor payouts begin to scale. Tools built for low-value, low-visibility procurement can tighten approvals and policy. They are not automatically built for payout-state tracking, retry safety, payout failures, or reconciliation evidence. That gap is the real decision here.