

Quick Answer
Allocate support, operations and finance work plus non-duplicated overhead to payout cases. Retain unattributed work and distinguish cases, contacts and payout obligations. Use category evidence and comparable cohorts to test fixes, tracking total effort, overdue payouts and net benefit as well as unit cost.
Delayed disbursement tickets are not always just a queue problem#
Delayed disbursement tickets are not always just a queue problem. In many teams, one customer contact triggers additional internal follow-up, so visible ticket counts can understate total operating effort.
A payout support ticket cost calculator should use your own measured handling, investigation and follow-up costs. Outsourced help-desk quotes price a different service and can bundle different coverage and margins. Build a local baseline with named inputs rather than importing a published per-ticket range as the cost of a delayed payout.
A workable model needs to do three things. First, it should calculate fully-loaded cost per ticket rather than stopping at agent time or salary-only estimates. Second, it should group tickets by the failure point that created the contact so you can see whether the expensive problem is, for example, status visibility, provider routing, ledger posting, reconciliation close, or a true exception. Third, it should turn that analysis into a decision about what to fix before you hire more people or push more volume through the same weak spot.
One early checkpoint matters. If your support data cannot reliably tie a ticket to a real payout event, a payout status change, or a known exception path, the numbers may look precise but still fall apart in review with finance or ops. The same goes for cost inputs. You need a baseline that includes direct handling labor and overhead such as management, tooling, and training. Treating cost per ticket as a salary-division exercise can understate the true burden, especially when low first-contact resolution creates follow-up drag and pushes work into other teams.
The goal of this article is simple: build a calculator you can defend in a monthly review and use to make changes you can verify. You should come away able to quantify fully-loaded cost, spot the highest-cost payout failure points, and connect each one to a concrete fix that can be checked against outcomes, not just intentions. If the model is doing its job, it will answer a more useful question than "How busy is support?" It will show which payout problems are expensive enough, and repeatable enough, to deserve immediate operational attention.
Related: Publisher Payment Thresholds: How to Set Minimum Payout Limits That Reduce Cost Per Transaction.
Define the calculator and the decision it must drive#
A payout support ticket cost calculator should be treated as a payout-operations model, not a generic support-cost tool. Its purpose is to show what payout-related contacts actually cost after handling, investigation, reconciliation work, and exception follow-up are counted together.
Use strict scope so the number stays defensible:
| Include in model | Exclude when unrelated to payout work |
|---|---|
| Delayed disbursements | Account access issues |
| Reconciliation breaks | Profile edits |
| Settlement exceptions | Promos and marketing contacts |
| Payout status investigations | Onboarding contacts not tied to payout flow |
Keep known payout-related work in scope, including contacts about a transfer that was never created. Link it to an obligation, request, payout or exception record where possible. Put unlinked cases in a visible Unattributed bucket with their measured cost; investigate the missing link before recommending a category-specific fix. Do not make costs disappear by excluding poorly tagged work.
The calculator should produce three related outputs:
- Fully-loaded monthly cost by failure category, including an Unattributed bucket
- Cost per distinct case worked, per contact and per payout obligation for the same period and scope
- Workload and backlog measures alongside attributable, potentially avoidable cost; actual loss exposure remains a separate estimate
If category unit costs rise over two reviews, investigate tagging, case mix, handling time, provider incidents and backlog before choosing a fix or a staffing change. Instrumentation may be the problem, but rising unit cost alone does not establish the cause. Check urgent unresolved cases immediately rather than waiting for two cycles.
Separate staffing capacity from the cost allocation: recovered hours can reduce overload even when payroll cash spend stays unchanged.
Tag every payout ticket by failure point before doing any math#
Give each payout case one primary verified failure point or Unattributed. Keep symptoms and accountable causes separate. This preserves total cost while preventing overlapping category tags from counting the same case twice.
Tags are operational, not cosmetic. They add context and support tracked workflows and business-rule handling. Use one field for the primary failure point, then separate tags for the customer-facing symptom. A subject like "where is my money" is a symptom; your team still needs a grounded failure-point label supported by payout records.
Use structured ticket fields where your tool supports them. For example, Zendesk supports conditional required fields and reporting on custom fields. Keep one primary failure-point field and separate symptom, cause and channel attributes; multiple tags should not cause the same case’s cost to be charged to multiple categories.
| Failure point | Support symptom | Required evidence | Owning team |
|---|---|---|---|
| Initiation | Payout not visible as created | Payout ID or missing creation record, request timestamp | Payout product or operations |
| Provider routing | Sent but not progressing through the external rail | Provider reference, routing result, status history | Payments operations |
| Status update | "Where is my money" with unclear state | Payout status (pending, paid, failed, or canceled) and event timestamps | Product and support operations |
| Ledger posting | Mismatch after payout movement | Ledger entry plus internal-to-external record comparison | Finance ops or ledger team |
| Reconciliation close | Batch or settlement does not tie out | Reconciliation case, transaction history, settlement report, or exception record | Finance ops |
Keep symptom handling and root-cause tagging separate. Incident response answers the user now; root-cause tagging helps prevent repeats. If an agent cannot support a root-cause label with payout evidence, keep the ticket in symptom triage until the record is complete.
A case without a verified failure point remains Unattributed. Include it in total workload, cost and backlog, show the unattributed share, and assign an owner to resolve the missing evidence. Do not claim a category-specific saving from an unverified label.
For retention impact, see Bad Payouts Are Costing You Supply: How Payout Quality Drives Contractor Retention.
Build the fully-loaded baseline cost model#
Start with one number: fully-loaded cost per ticket. If you only count agent salary, you will understate what payout delays and exceptions actually cost.
Use allocated in-scope monthly cost ÷ distinct in-scope cases worked during that month as a period baseline. Include prior-month cases worked this month and label this denominator; created cases and resolved cases are different measures. Report those counts and opening/closing backlog separately. Shared-team spend must be allocated to payout work before dividing it by payout cases.
Define the numerator before you trust it#
Include support, payments-operations and finance investigation time once, with compensation and benefits reflected in the appropriate hourly rate or monthly allocation. Add management, QA, tooling, training and other allocated overhead once. Choose either a capacity/spend allocation or measured handling time multiplied by rates for each labor component; do not add the same salary again as handling labor.
| Cost component | Allocation basis |
|---|---|
| Support handling | Measured payout-related hours × compensation-and-benefits rate, or allocated staffing spend |
| Payments/finance investigation | Logged hours or a documented payout allocation; exclude time already in support cost |
| Management, QA and training | Documented share of the relevant cost pool |
| Tools and infrastructure | Payout-specific invoices or justified shared-use allocation |
Make each cost pool mutually exclusive and reconcile the allocated total to finance records. If using a fully-loaded rate that already includes management or tools, do not add them again. Record allocation assumptions and sensitivity; the model needs a reconciled amount, not benchmark percentages that can sum above 100%.
Define each input so it is auditable#
| Field name | Owner | Source system | Refresh cadence | Common data-quality failure mode |
|---|---|---|---|---|
| Distinct payout cases worked and contacts | Support operations | Deduplicated case/contact export, including carry-in and Unattributed payout work | Monthly | Created, worked and resolved cases mixed; untagged work omitted |
| Agent compensation and handling labor | Finance or support leadership | Payroll, invoices, staffing roster | Monthly | Shared staffing allocated incorrectly |
| Management and QA allocation | Support leadership | Roster, allocation sheet, budget mapping | Monthly | Lead/QA effort omitted |
| Tooling and infrastructure cost | Finance or IT owner | Billing records and invoices | Monthly | Platform-wide tooling misallocated |
| Training and enablement cost | Support leadership or enablement owner | Training logs and budget lines | Monthly or quarterly | Onboarding or retraining spend excluded |
Where possible, tie these inputs back to payout operations records, for example, support logs, ledger events, reconciliation reports, and payout status history, so the model stays anchored to real work.
Set one checkpoint before modeling savings: have finance and support leads confirm the baseline reflects true fully-loaded cost, not salary-only estimates.
For separate rail charges, see Platform Payout Cost Estimator for Wire, ACH, and Local Rails. Keep payment fees distinct from support cost unless the model explicitly includes both.
Worked example: one month, three denominators#
Assume a hypothetical month with 100 distinct payout cases worked, 150 contacts and 1000 payout obligations. Support handling is 40 hours × 30 = 1200; finance investigation is 10 hours × 50 = 500; allocated management/tools/training not included in those rates is 300. Total support-related cost is 2000: 20 per case, approximately 13.33 per contact and 2 per payout obligation. Keep all amounts in one currency. Five Unattributed cases remain inside the 100 cases and their costs inside the 2000.
| Measure | Baseline | Comparable pilot |
|---|---|---|
| Cases / contacts / payout obligations | 100 / 150 / 1000 | 100 / 120 / 1000 |
| Support handling | 40h × 30 = 1200 | 30h × 30 = 900 |
| Finance investigation | 10h × 50 = 500 | 8h × 50 = 400 |
| Other allocated cost | 300 | 300 |
| Total | 2000 | 1600 |
| Per case | 20 | 16 |
| Per contact | 13.33 | 13.33 |
| Per payout obligation | 2 | 1.60 |
With comparable case mix and unchanged recipient outcomes, the pilot recovers 12 hours and reduces the allocation by 400. Fixed staff salaries can mean actual cash saving is zero. If implementation costs 1200 and additional tools cost 100 monthly, a genuinely avoidable 400 monthly cost yields 300 net and a four-month simple payback; if the 400 is capacity only, do not claim that cash payback. Preventing easy tickets may increase cost per remaining case even while total work falls.
For a separate follow-up scenario, assume 100 mature cases and one 20-minute follow-up for each case not resolved at first contact. At 70% FCR, 30 follow-ups take 10 hours; at 85%, 15 take five hours. The five-hour difference is a scenario estimate, not a benchmark or a guaranteed effect. If those follow-ups are already in measured handling hours, do not add them to the baseline again.
Model follow-up drag and channel economics#
Define first-contact resolution at case level, with a follow-up window and a mature cohort whose full window has elapsed. A first response or a solved status does not prove durable resolution. Zendesk’s metric definitions distinguish reply, first resolution and reopen measures. Link repeat tickets, calls and chats for the same issue before calculating FCR.
Estimate follow-up work as well as ticket count#
Run two scenarios side by side for each high-volume failure tag:
| Scenario | Hold constant | Change | Compare |
|---|---|---|---|
| Current state | Weekly case volume, observed channel mix | Actual FCR | Carry-forward work into next week |
| Improved FCR state | Weekly case volume, observed channel mix | Higher FCR tied to a specific fix | Carry-forward work into next week |
If reopen or cross-channel linkage is incomplete, show coverage and label the result a proxy. Keep the same cohort and observation window across scenarios; a recently opened case without follow-up yet is not established first-contact success.
Use a regular reporting cadence (daily or weekly) so slowdowns show up early instead of appearing late as hidden workload.
Break out channel mix before prescribing fixes#
Model channel mix by failure tag using your own records, and reconcile help desk, chat, and phone data before you draw conclusions. Disconnected systems can produce conflicting counts, which distorts follow-up drag and hides true effort.
If a category is both phone-heavy and low-FCR, prioritize root-cause fixes and clearer status visibility before chatbot deflection. That sequence is easier to explain in ops review and usually reduces repeat-contact pressure first. See Payout Status Page Design: How Platforms Reduce Where-Is-My-Money Support Tickets.
Document the FCR definition, mature cohort, follow-up window, channel assignment, cross-month work and cost allocation. Track contacts separately from distinct cases, and assign each handling interval once even when multiple teams collaborate.
Prioritize fixes by cost driver, not by loudest queue#
Prioritize each expensive failure tag by root cause and assign one primary fix per tag. If you bundle product changes, status messaging, process controls, and ticket deflection together, you will not know what actually reduced cost per ticket or improved first-contact resolution.
Start from why the ticket exists, not which queue it hit. In triage, requests are assessed, categorized, prioritized, and routed, so your fix logic should follow that same path: is the issue mostly status confusion, a real operational exception, routine repeat questions, or bad routing?
| Cost driver pattern | Primary intervention | Verification checkpoint | Accountability rule |
|---|---|---|---|
| Users keep asking for updates because payout state is unclear | Status visibility | Fewer repeat contacts and reopens for the same payout-status stage within your follow-up window | One named owner |
| Tickets reflect a real payout break or exception that needs investigation | Process control | Fewer aging exception cases and faster closure of exception-handling workflows | One named owner |
| Requests are routine and answerable from known policy or status rules | Ticket deflection via self-service knowledge base or chatbot | Deflected issues do not come back as agent-handled contacts in the same issue window | One named owner |
| Cases arrive with the wrong team or missing required detail | Intake and routing fix | Lower reassignment rate and fewer bounce-backs between teams | One named owner |
Use a strict if-then rule. If repeated contacts come from unclear status, improve payout status communication first. If repeated contacts come from real breaks, fix reconciliation and exception handling first.
Be explicit about tradeoffs. Chatbots and self-service content can reduce repetitive volume, but they do not replace controls for true settlement exceptions.
Before funding automation, measure reassignments and their actual extra handling time by category. Inspect cases for missing detail, unclear ownership and provider references. Use conditional intake questions to collect required evidence, then test whether reassignment and repeat-contact hours fall without hiding unresolved payouts.
Keep ownership singular even when execution is cross-functional: assign one accountable function per intervention, and make supporting roles explicit.
For all-in payout economics, read Unit Economics for Payment Platforms: How to Calculate True Cost Per Payout.
Implement with an operator checklist and monthly checkpoints#
Use a three-phase implementation: baseline, targeted pilot, then broader rollout only after verification passes.
Lock the checklist before you pilot#
Before any team changes queues, content, or payout status surfaces, confirm:
- taxonomy is finalized and failure-point tags are used consistently
- input fields are validated, including cost inputs and fields used for monthly ticket volume
- baseline is approved so pilot results are compared to a stable starting point
- scenario assumptions are logged in plain language (what changed, what stayed fixed, and what is in scope)
- one owner and one measurement reviewer are assigned
- monthly review cadence is set before rollout starts
Keep known payout work with missing links or tags visible in Unattributed, including its time and cost. Resolve the data gap before assigning a category-specific intervention.
Review one evidence pack every month#
Use one system of record for supporting documentation so support, product, and finance review the same inputs each cycle.
| Evidence item | What to include |
|---|---|
| Monthly ticket volume | Updated monthly ticket volume |
| Cost inputs | Updated cost inputs |
| First-contact resolution | First-contact resolution trend |
| Channel distribution | Channel distribution |
| Failure-point changes | Top failure-point changes since the prior review |
| Assumption changes | Any material assumption change logged next to the numbers |
Include updated monthly ticket volume, cost inputs, first-contact resolution trend, channel distribution, and top failure-point changes since the prior review. Log any material assumption change next to the numbers.
Use one gate before wider rollout#
Scale only when the intervention reduces total effort or cost per comparable payout obligation without worsening overdue cases, unresolved payout value or recipient outcomes. Cost per remaining ticket can rise after easy questions are prevented; inspect total cost, workload and case mix rather than making that ratio the sole gate.
Keep the rollout order strict: baseline first, then targeted pilots, then broader rollout after each category clears the checkpoint. If one metric improves while backlog health worsens, stop and correct before scaling. Related reading: Contractor Payout Speed Calculator by Rail and Country.
Account for market and program variance before rollout#
Do not scale a pilot across markets or programs until local variance is explicitly scoped. Treat each segment as in-scope only when the payout execution path, policy gating, and provider operating pattern are known well enough for a like-for-like comparison.
| Variance check | Record before launch |
|---|---|
| Live payout path | The live payout path for every market and program in the sample |
| Manual or policy review | Whether manual or policy review can pause disbursement |
| Authoritative status timestamps | Which status timestamps are treated as authoritative for support decisions |
Add a simple variance check to the monthly evidence pack before launch. For every market and program in the sample, record the live payout path, whether manual or policy review can pause disbursement, and which status timestamps are treated as authoritative for support decisions. If those inputs are unclear, keep that segment out of rollout until they are clarified.
Use records appropriate to each question: obligations and request logs for what was owed and initiated, provider status and recipient/bank evidence for execution or receipt, and ledger movements for accounting. A ledger entry alone does not prove that the recipient received funds. Spot-check both timing and money-movement references before using a case as evidence of a delay or resolution.
Keep this stage conservative when evidence is incomplete. Label unknowns directly, avoid synthetic benchmarks, and do not track exceptions only in ad hoc spreadsheets, where manual errors, version drift, stale data, and weak audit trails can obscure real variance.
For attribution methods, see Spend Analytics for Platforms That Turns Payout Data Into Cost Decisions.
Conclusion#
A useful payout support ticket cost calculator is only worth keeping if it changes what your team does next. The value is not in a single blended cost-per-ticket number. It is in linking fully-loaded cost to the exact place where payout execution, ledger handling, or reconciliation is creating repeat work.
Build the baseline from allocated payout-related costs and a labeled case-work denominator. Keep created, worked and resolved cases separate, retain Unattributed work and validate receipt evidence against the agreed payout endpoint. Without those distinctions, a precise-looking unit cost can mislead staffing or automation decisions.
Separate three outcomes: lower fully-loaded allocation, recovered operating capacity and avoidable cash spend. Reducing handling hours can free staff time while salaries stay fixed. Claim cash savings only where a cost actually disappears or a documented future expense is avoided; show implementation and ongoing tool costs in the net estimate.
Your best next move is narrow, not broad. Run a time-boxed pilot on the highest-cost delayed-disbursement category, then require measurable improvement before you expand automation, headcount, or self-service. The checkpoint should be explicit:
- Lower total effort or cost per comparable payout obligation, with cost per case/contact and case mix still visible
- No worsening in aged backlog, unresolved payout value or recipient outcomes
- Sampled cases match obligation, execution/receipt and accounting evidence
- Net benefit includes implementation and ongoing costs; recovered capacity is distinguished from cash savings
If any of those conditions does not hold, inspect the intervention before scaling it.
Version source extracts, status definitions, tags and allocation rules with every review. Keep as-of dates and correction history so new evidence does not silently rewrite a prior pilot result.
Baseline once with mutually exclusive costs, then pilot a specific fix against comparable cases and payouts. Review workload, recipient outcomes and net benefit together before expanding. Status visibility can prevent unnecessary contacts, while true payment failures need an execution or reconciliation fix.
Frequently Asked Questions
What is a payout support ticket cost calculator, and how is it different from a generic support cost calculator?
A payout support ticket cost calculator is a scoped support-cost model where you measure tickets your team classifies as payout-related. A generic support cost calculator usually starts with team size, agent cost, and monthly ticket volume. That is useful for a baseline, but you still need clear internal ticket categorization to make the payout view reliable.
Which inputs matter most for a reliable payout ticket cost per ticket calculation?
Use distinct cases, contacts, measured team time, labor rates or staffing allocations, and overhead that is not already in those rates. Include Unattributed payout work and separate opening/closing backlog. Link cross-channel follow-up to the same case and show missing-data coverage.
How do we calculate a fast baseline without overengineering the model?
Divide the allocated in-scope monthly cost by distinct payout cases worked in that month, including carry-in cases. Label the denominator and also show created cases, resolved cases, contacts and backlog. Use mutually exclusive labor and overhead components; finance and support should approve the allocation before comparing interventions.
Why do first-contact resolution and follow-up tickets change true support cost so much?
One case can create several contacts and internal investigations. Count all handling time once, link repeat contacts to the same issue, and use a mature follow-up window for FCR. Acknowledgement or solved status alone does not establish that the payout obligation was resolved.
When should we use ticket deflection versus fixing payout operations and reconciliation controls?
Use deflection for repetitive status questions when issues are mainly informational. Prioritize process fixes when your own ticket data shows recurring unresolved issues that keep generating human follow-up. If a category remains phone-heavy or repeatedly reopens, review the underlying workflow instead of relying only on FAQ or bot coverage.
What are the biggest gaps in generic SERP calculators for payout-heavy platforms?
Generic calculators can miss shared-team allocations, duplicate cost pools, carry-in work, repeated contacts, unattributed cases and payout receipt evidence. A fall in ticket count can also change the remaining case mix. Compare total cost and cost per payout obligation alongside cost per case, backlog and unresolved payout value.
How often should finance, support, and product teams recalculate and review results?
Review monthly at minimum, because ticket volume and channel mix can change quickly. Recalculate sooner after major workflow, tooling, or policy changes. The monthly pack should include ticket volume, cost inputs, repeat-contact trend, and a spot-check that ticket categorization is still consistent.
Try a related tool
Researched and edited by the Gruv editorial team. Gruv builds cross-border billing, payouts, and finance-operations software for global businesses.
Sources
Includes 2 external sources outside the trusted-domain allowlist.
Educational content only. Not legal, tax, or financial advice.
Related Posts
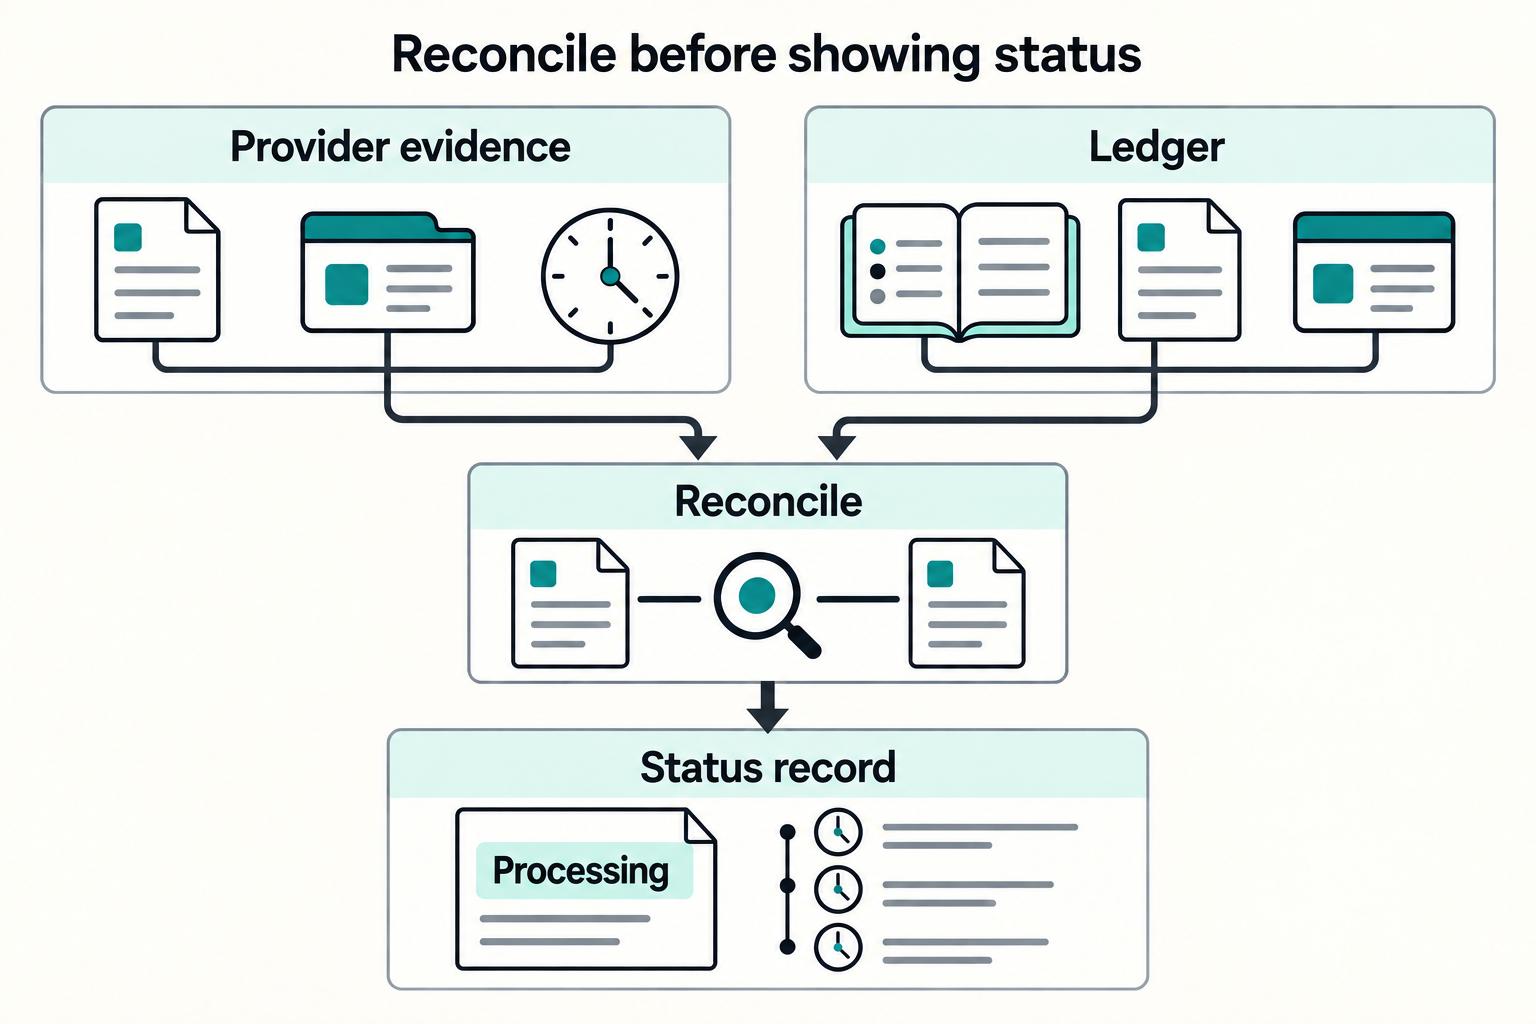
Payout Status Page Design That Reduces Where-Is-My-Money Tickets
Many examples of **payout status page design** focus on visual inspiration instead of operating guidance. Layout ideas can help, but they do not answer the question your finance or support team asks most: where is the money, who owns the next step, and what proof do we have?
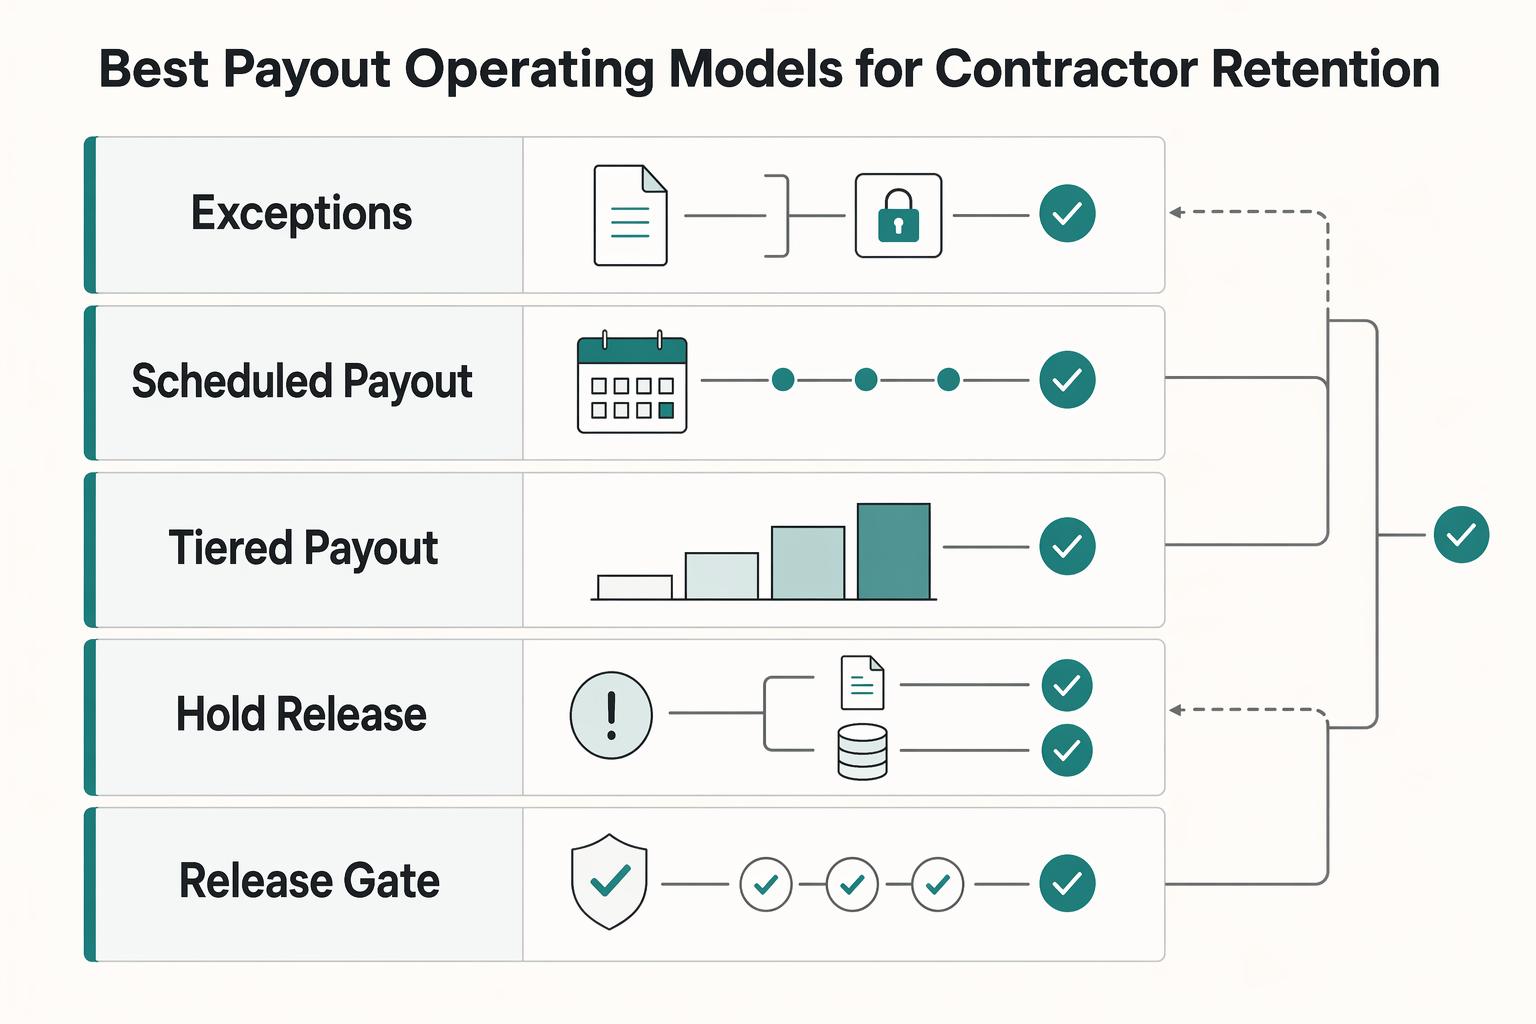
Bad Payouts Are Costing Your Supply in Two-Sided Platforms
Payout issues are not just an accounts payable cleanup task if you run a two-sided marketplace. They shape supply-side trust, repeat participation, and fill reliability. They can also blur the revenue and margin signals teams rely on.
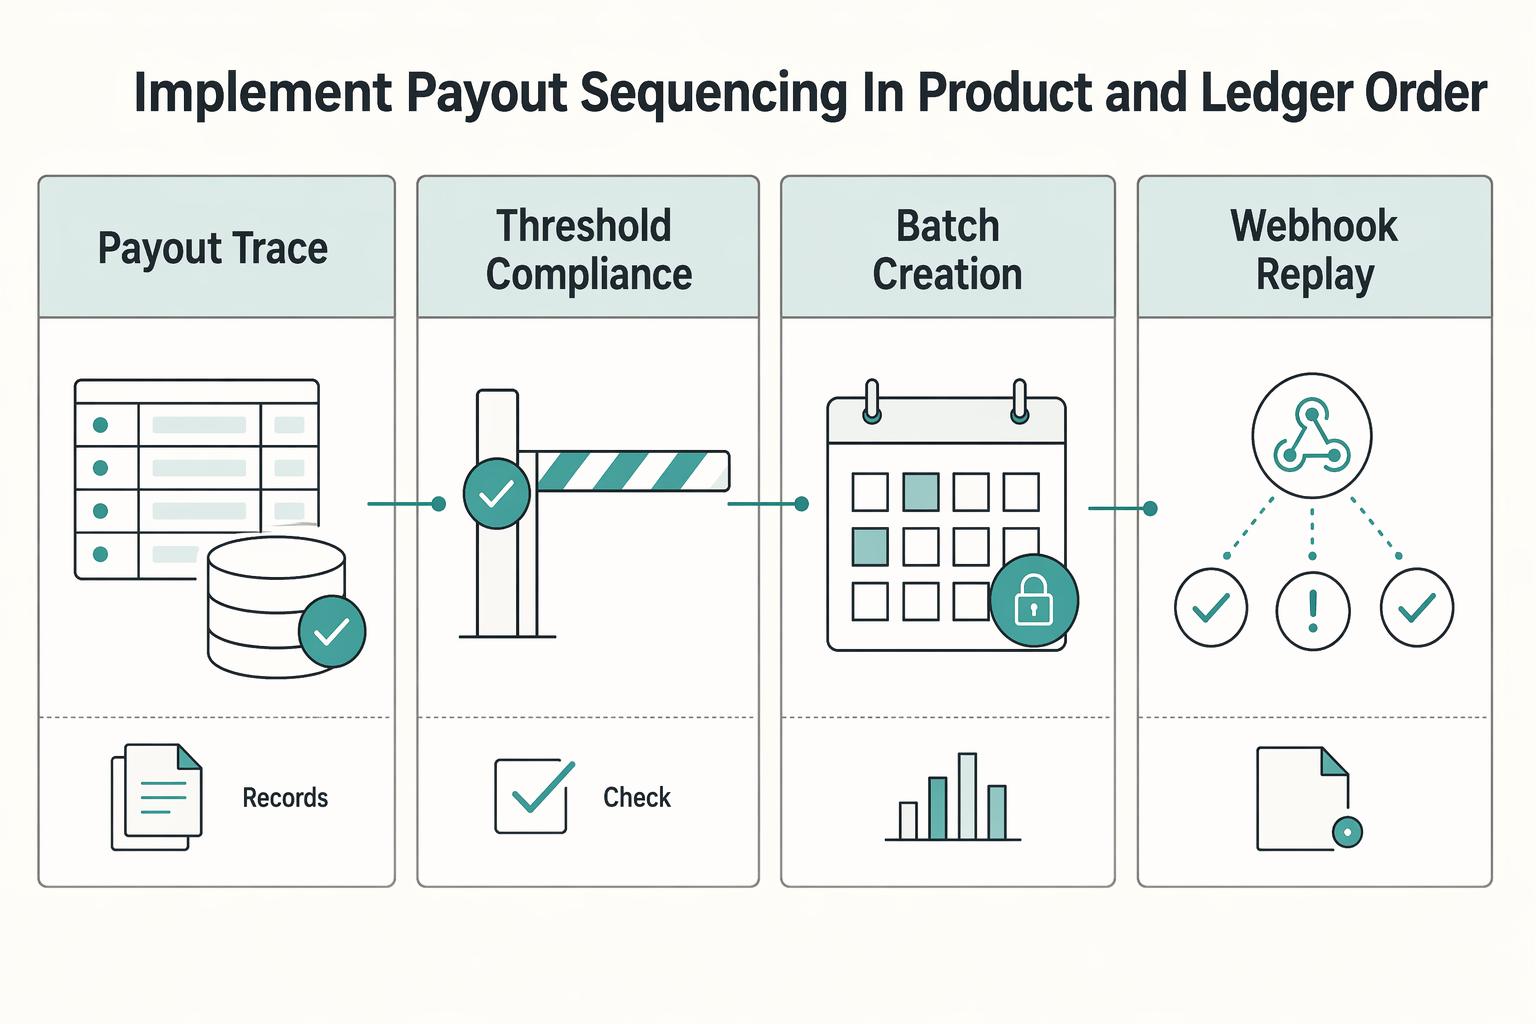
Set Publisher Payment Thresholds Without Delaying Recipient Payouts
Set payout minimums to manage transaction costs, but only if recipients can still predict when they will be paid. If thresholds are unclear or scoped poorly, you may lower fee drag while increasing rollover balances and "where is my payout?" pressure on operations.