
Quick Answer
Divide the period’s payout-service costs by unique recipient obligations first meeting a defined completion outcome in that period. Include failed-attempt costs, actual fees and handling, and documented shared allocations. Keep unallocated costs visible, retain an as-of cutoff and correction policy, and report attempts, unresolved obligations and cohort follow-up separately.
Why most payout unit economics break at scale#
Payout unit economics break at scale when teams track revenue and headline margin, but not the full cost layers behind each disbursement. If finance, ops, and product cannot trace margin drift back to underlying records, the metric is not ready to guide decisions.
Where the drift hides#
A payout fee is only one layer of operating cost. A higher-volume month may spread fixed overhead across more completions, while failures, manual work or an expensive corridor raise variable costs. Negative contribution per payout can worsen with volume, but a fully loaded loss caused by unused fixed capacity does not prove that every additional payout loses money. Separate variable and shared costs before making that decision.
Pick the right unit for payout operations#
This article uses payout execution work as the unit, not customer acquisition performance. The scope is operating cost per payout, with explicit rules for what is included and excluded. CAC and observed LTV still matter, but they answer a different question than the operating cost of delivering payouts each month.
Build a model you can defend, not just present#
The goal is an audit-ready per-payout cost model that finance, ops, and product can run monthly and defend. That means a stable unit definition, clear in-scope and out-of-scope cost rules, and source data behind the published number. If you cannot explain movement with itemized cost layers and supporting records, the model will not hold up in review.
What to expect from the rest of the article#
The article follows that sequence. First define the unit. Then prepare the minimum data pack, estimate cost per payout, handle edge cases, apply decision rules, and finish with a copy-and-paste close checklist. The target is not a cleaner KPI slide. It is a monthly operating measure you can trust.
Define the unit before you calculate anything#
Define the unit and boundary before you run any math, or the result will not survive review. If your unit is Completed Payout, define it explicitly. Then set the True Cost per Payout boundary so scope changes do not quietly change the number.
Lock the Completed Payout definition#
Use a practical reporting definition: one unique recipient-payment obligation first reaches the agreed delivered outcome during the month, is not known to be returned at the stated extraction cutoff, and has authoritative provider evidence. Store a stable obligation ID across attempts and reissues. A created payout, accepted request or callback count is not a completed unit. This is an internal management measure, not a claim of irreversible legal finality.
Write the outcome test separately for each rail/provider. Stripe’s payout object, for example, distinguishes pending, in_transit, paid and failed, and warns that some paid payouts later fail. Keep the status history and your cutoff timestamp; reconcile bank evidence where available and label any completion based solely on provider evidence.
Set the denominator boundary before cost math#
For the monthly throughput measure, count each obligation once in the month of its first qualifying completion. Include all in-scope payout operating costs incurred that month, including failed attempts and work on older cases. This period ratio is not a lifetime cost for that month’s completed cohort. Publish cohort follow-up separately when later repair costs or returns materially change the picture.
Keep execution activity and completed units separate. If those get mixed together, average cost per unit can move for tracking reasons instead of operating performance.
Separate payout cost from CAC and LTV#
CAC measures acquisition cost; an LTV model estimates customer value over time, commonly on a contribution basis for comparison with CAC. Neither belongs in payout execution cost unless the report explicitly includes a separate business-wide allocation. Keep growth and operating scorecards distinct.
Many startup models use four growth metrics: CAC, LTV, CAC payback period, and LTV/CAC ratio. Those are useful for growth decisions, but they do not define payout execution cost.
Set one reversals and reissues policy#
At close, link every return or reissue to its original obligation. Exclude an obligation known to be returned at cutoff unless a permitted reissue has reached the defined outcome. A returned item that is still unresolved is not a completion. After publication, retain the original report, log the correction and provide a revised cohort view when material; do not silently rewrite history. A later reissue of an already-counted obligation is repair work, not a fresh new unit.
Example: 100 obligations generate 108 attempts because eight retry. If 96 unique obligations meet the outcome test at cutoff, the denominator is 96, not 108. All incurred attempt and investigation costs remain in the numerator. Four unresolved obligations stay visible by age, amount and reason.
For a step-by-step walkthrough, see ERP Integration for Payment Platforms: How to Connect NetSuite, SAP, and Microsoft Dynamics 365 to Your Payout System.
Prepare the minimum data pack before modeling#
Before you model cost per payout, build a traceable evidence pack that ties each modeled unit to execution, conversion, and compliance records. In practice, data gaps can undermine confidence faster than formula choices.
| Element | Include | Checkpoint |
|---|---|---|
| Core ledger records | Stable obligation ID, attempt IDs, amount/currency, completion basis/date, return history and reconciled journal references | From a sampled payout, move from a modeled unit to an internal posting to provider evidence, and back again, without changing population or period |
| Provider fee and status data | Actual fees/credits, provider payout IDs, status history and cutoff timestamp | Explain fee records and final outcomes for the same modeled payout population |
| FX quote inputs and outcomes | FX quote inputs with actual conversion outcomes; keep each route distinct, including convert-transfer-convert-back flows | Compare harmonized all-in costs by rail, corridor, and payment value |
| KYC, KYB, and AML evidence | Review cost and a defensible direct or shared allocation to the payout function; restricted case detail kept separately | If a cost cannot be tied to modeled activity with a defensible rule, keep it in a separate pending-allocation bucket |
Export core ledger records and keep reconciliation references attached#
Start with your core ledger records for the same period and payout population defined in your reporting policy, then keep the provider references used in reconciliation attached.
Your pass-fail check is traceability. From a sampled payout, you should be able to move from a modeled unit to an internal posting to provider evidence, and back again, without changing population or period. This matters even more across cross-border corridors, where cost and speed can vary materially by corridor.
Pull provider fee data and status-event evidence#
Pull fee invoices, credits and transaction-level records alongside payout status history. Stripe’s fee export guidance describes fees by transaction/product and reporting access. Reconcile a detailed fee amount to its summary rather than adding both. A fee credit reduces the applicable cost once; it is not a second revenue stream.
You do not need a perfect event taxonomy. You do need enough provider-side evidence to explain fee records and final outcomes for the same modeled payout population.
Capture FX quote inputs and actual conversion outcomes#
For cross-currency payouts, keep FX quote inputs with actual conversion outcomes. Without both, it is harder to separate provider pricing from FX effects.
Structure extracts so you can compare harmonized all-in costs by rail, corridor, and payment value, rather than averaging unlike flows together. If you run multiple rails, keep each route distinct, including convert-transfer-convert-back flows.
Build a policy evidence pack for KYC, KYB, and AML costs#
Include the cost of payout compliance, including shared ongoing monitoring, where the function and allocation basis are defensible. A compliance activity does not need to block a specific payout to belong in a fully loaded payout service cost. Keep direct checks, shared monitoring and unrelated corporate compliance separately labeled.
If linkage or allocation is uncertain, put the amount in a visible unallocated-cost bridge and show coverage. Do not call the allocated number fully loaded while silently omitting known service costs. Restricted AML case material and tax IDs need not appear in the KPI pack; aggregate cost and reviewed status are enough for broad reporting.
If you need a benchmark for whether your payout costs are actually improving, see Payment Benchmarking for Platforms: How to Compare Your Payout Performance Against Industry.
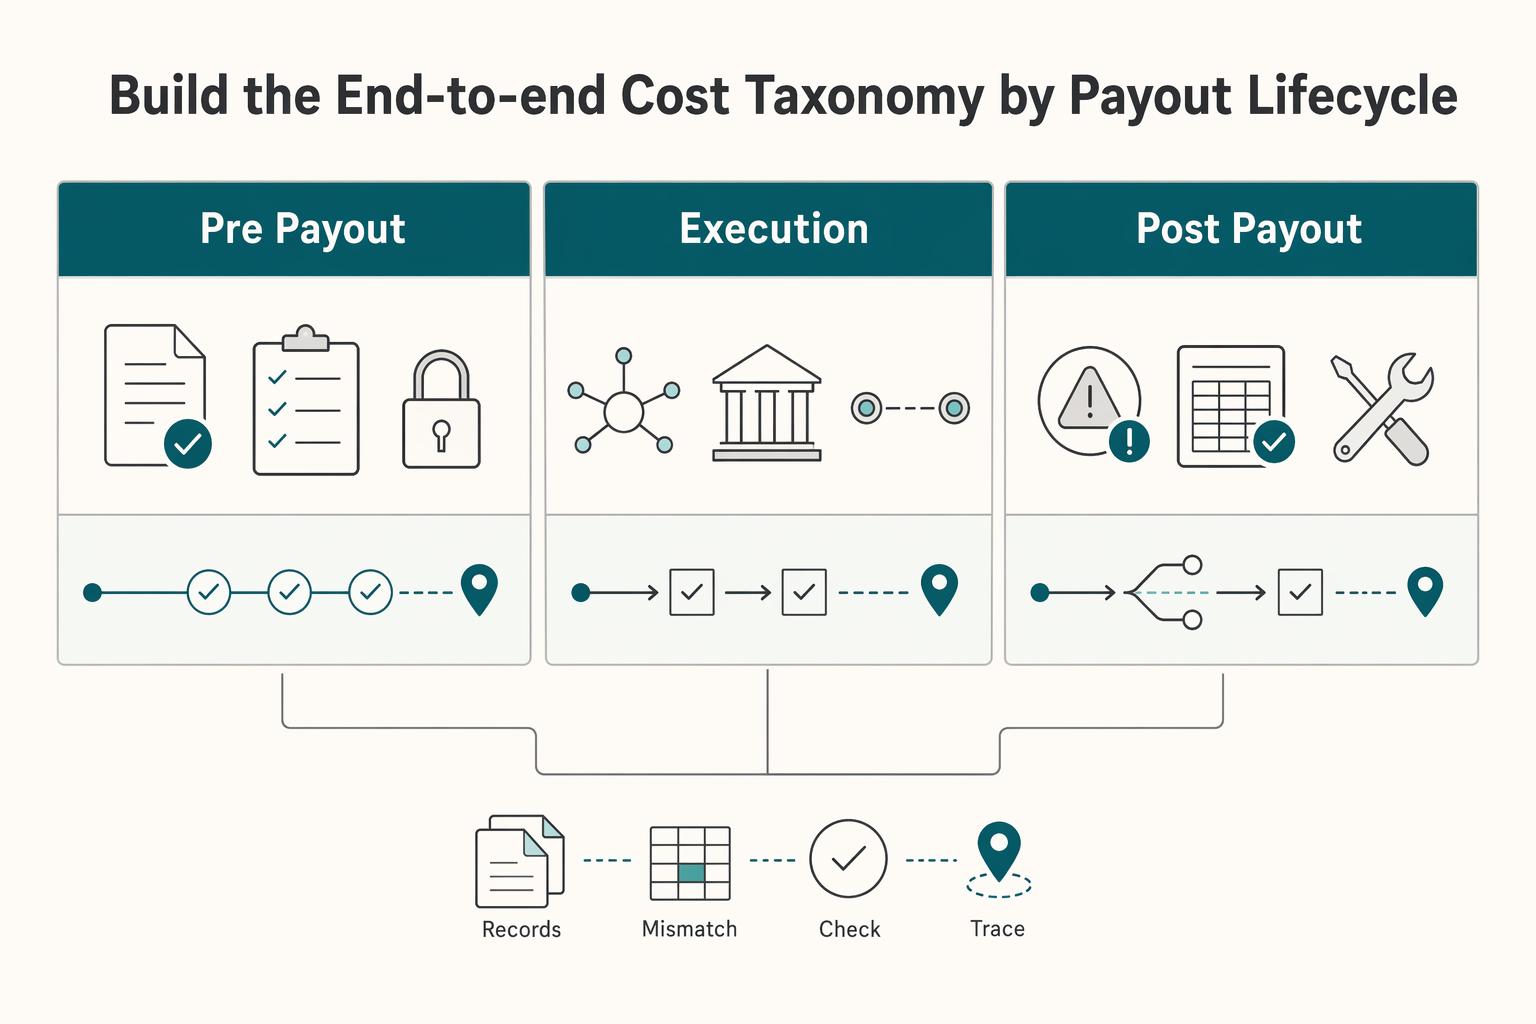
Build the end-to-end cost taxonomy by payout lifecycle#
Classify direct and allocated costs under pre-payout controls, execution and post-payout resolution. Do not add lifecycle totals on top of the same costs already counted by account. Costs lacking a supported allocation remain visible in an unallocated bridge; publish the unit result as provisional or partial when those amounts are material.
The goal is not a tidy chart of accounts. It is a taxonomy finance, ops, and product can use to explain where cost enters the flow, where it stalls, and where it gets reworked.
| Bucket | What belongs here | Minimum evidence to tag it |
|---|---|---|
| Pre-payout | compliance and approval controls that gate release | review record, approval timestamp or queue history, linkage to the payout population |
| Execution | participant/provider fees, route or rail choice, transaction and settlement timing fields | fee record, route reference, transaction/settlement status and timestamp |
| Post-payout | failed processing, retries, exception handling, support and investigation work | terminal failure or exception event, retry chain, case or investigation record |
Map stages to a real transaction and settlement flow#
Map your actual payment flow using provider status documentation, fee reports and ledger entries. An instruction, accepted request, transfer debit and destination credit mark different stages. The unit cost is a management calculation based on your service boundary; unrelated medical studies, transit valuation or equipment-cost guidance do not establish payout definitions.
For each path, define release approval, submission, the observed completion test and subsequent return/repair paths. Legal settlement finality comes from the rail and applicable law, not an internal status policy. Maintain the as-of measurement point so late events can be explained.
Use one Completed Payout and one failed attempt from the same period as a validation sample. If you cannot name the artifact that marks stage entry and exit, the taxonomy is still too abstract.
Allocate pre-payout and ongoing compliance costs to the function they support#
Direct release checks can attach to individual obligations; ongoing account monitoring can use a documented shared-cost driver. Separate those from unrelated activities. Link the trigger, work or supported function to the cost pool without claiming that all monitoring has a one-to-one payout record.
Use actual handling minutes and loaded staff cost for direct work. For broader monitoring, allocate the payout function’s share based on a defensible activity or time driver and disclose its amount. Keep unallocated cost visible until the driver is supported.
Checkpoint: for a sampled payout with a compliance step, you can show the review record, outcome, timestamp, and consistent linkage to the release decision.
Split execution into fee, route, and settlement fields#
Do not stop execution costing at participant/provider fees. Keep three fields together: fee records, route or rail decision, and final-status timing.
Route choice changes fees, funding needs, recipient net and the work required to complete a payout. Capture those dimensions so later comparisons use matched cohorts. A faster route may have a larger explicit fee but less manual repair; neither conclusion can be inferred from a fee card alone.
If you use multiple routes, keep them distinct instead of averaging unlike paths.
Checkpoint: for a sampled payout, you can show the provider or participant reference, fee record, chosen route, and the final outcome for your period policy.
Treat post-payout resolution as a first-class cost bucket#
Treat post-payout resolution as explicit, not residual. Include failed processing, retries, exceptions, and the support or investigation work needed to close them. This aligns with treating product-specific risk paths and control checkpoints as part of the operating model.
Cost actual work once. Multiple provider events may describe one attempt or case, while one obligation can require several distinct investigations. Record case/work IDs and time entries; deduplicating callbacks must not erase real handling effort. Payout principal returned by a bank is a movement of funds, not automatically an operating expense; actual fees or unrecovered losses need their own treatment.
Checkpoint: each post-payout line should tie to a terminal failure event or an exception case with retry chain and resolution notes. Once these tags are stable, allocation gets cleaner. You move from arguing about cost type to allocating shared overhead across defined lifecycle buckets with evidence behind each one.
For a broader cost model beyond payout unit economics, see How to Calculate Payment Processing Fees: A Total Cost of Ownership Framework for Platforms.
Allocate shared overhead with accounting rules people can defend#
Allocate shared overhead explicitly, with documented rules, or your True Cost per Payout will stay easy to challenge. If another operator cannot trace your logic and reproduce the result, the allocation rule is not ready.
Keep overhead explicit in the unit-cost view#
Separate direct fees and work from shared payout-service expenses such as infrastructure, support management and relevant compliance monitoring. Allocate rent, insurance or other corporate expense only under a disclosed broader scope. Keep acquisition marketing outside the payout execution view; a business-wide cost report can show it separately.
Keep compensation, overhead, and profit in distinct buckets rather than blending them.
Define allocation rules by cost pool and version them#
Use a cost-pool-specific driver: handling minutes for support, verified API/resource usage for variable tooling, and a supported function share for shared staff or infrastructure. Include idle capacity separately when it materially explains cost. Document total pool, allocated amount and remaining unallocated amount so every source dollar has one destination.
Version every rule change with an effective date, cost-pool name, and reason for change. Without that history, trend movement can reflect rule drift instead of operating performance.
Keep support and tooling costs visible#
Treat platform support and tooling as explicit allocations, not miscellaneous. A defensible evidence pack is simple: the operating-expense lines you included, the allocation logic you applied, and the final unit-cost output.
Reject rules you cannot defend quickly#
Require enough documentation for another analyst to reproduce each rule; a one-minute explanation is a communication test, not an accounting standard. Fixed-cost absorption can improve with volume while variable costs behave differently. Compare incremental contribution and fully loaded cost before deciding whether scale helps.
Adjust the model for failures retries and exception paths#
Use one versioned policy for units, period costs, corrections and allocations. Record both cost per first-completed obligation and attempt-level diagnostics; the second view explains failure work without inflating the main denominator.
Separate non-success work from successful outcomes#
Keep confirmed failed, canceled, pending and unknown outcomes separate from completed obligations. Their incurred fees and handling costs remain in the monthly numerator. Report unresolved count/value and age alongside the rate so a cheap-looking month cannot hide an unfinished backlog. If there are zero completions, show total cost and zero throughput; cost per completion is undefined, not zero.
Track retries as visible workload#
Persist the obligation and attempt before submitting a payout. Record amount, currency, provider key, response/retrieval evidence, outcome, fee and handling time. On a timeout, retrieve or reconcile the original attempt before any new one. Stripe idempotency guidance notes that keys can be pruned after at least 24 hours; your durable obligation record must prevent duplicates beyond that provider window and across providers.
Keep exception queues explicit and auditable#
For each exception, record obligation/attempt link, cause, amount affected, owner, handling time and outcome. Authenticate provider events and deduplicate economic journals. A callback retry is delivery activity, not necessarily a new payout attempt or charge; count a new external attempt only when supported by evidence.
Investigate cost movement with bucket-level evidence#
Worked monthly model: 10,000 obligations first complete at cutoff. Actual rail fees are $8,000, failure/return fees $500, FX execution charges $1,500, direct handling $2,000 and allocated shared payout-service costs $3,000. Total modeled cost is $15,000, or $1.50 per completed obligation. If a $1,000 service cost pool remains unallocated, disclose the $16,000 service total and $1.60 provisional fully allocated rate if that entire pool belongs to payouts; do not label $1.50 complete without resolving the scope. The fee and handling inputs include unsuccessful attempts; their counts do not enter the 10,000 denominator.
Related reading: SAP Integration for Payment Platforms: How to Connect Your Payout Infrastructure to SAP ERP.
Compare rails and routing decisions with corridor-level evidence#
Once failure costs are visible, routing decisions get clearer. Use corridor-level rows to compare options, because blended averages can hide tradeoffs. Keep rail type, currency path, and funding path separate so fees, timing, and rework are evaluated on the same unit.
Build the table at decision grain#
Use one row per corridor, provider, rail, currency/funding path and value band. Use the same completion and cost scope, then compare similar populations. A route handling easy transactions is not proven superior to a route handling difficult ones merely because its average is cheaper.
| Rail class to separate | Why keep it separate | Minimum checkpoint field |
|---|---|---|
| ACH | Bank/provider fees, cutoff and return exposure vary | Outcome evidence, return code/history, fees and handling |
| Wire | Intermediary charges and destination proof can differ | Provider/trace reference, recipient net and bank credit where available |
| Real-time payments | Eligibility, provider access, pricing and finality are product-specific | Authoritative outcome, funding debit, fees and any follow-up cases |
Then add fields for routing analysis where your own records support them: effective cost per completed unit, failure rate, time to final status, and rework burden. Include retry and exception allocation from the prior section and manual handling cost if assigned. Before you act on the table, sample rows and confirm traceability to ledger entries, provider status data, webhook history, and parent payout IDs.
Split Provider Routing into FX and non-FX views#
If your operation includes both native-currency payouts and payouts that require a Foreign Exchange (FX) Quote, run separate cuts for each view. This keeps routing comparisons readable and avoids blending distinct processing paths.
For FX-required rows, keep quote ID, quote timestamp, payout creation time, execution time, source and destination currency, final converted amount, and whether the original quote was used or replaced. If a row cannot be tied back to stored FX records, mark it incomplete for routing decisions.
Test batched release versus single payout release#
Treat batching as a scenario to test, not a default assumption. Compare batched and single release for the same corridor and payout size band, then review fee, completed count, delay to final status, and rework or exception volume.
Capture comparable timestamps for both paths: creation, approval, release, provider acceptance, and final outcome. This is a practical minimum to evaluate where delay may enter the flow.
Assess VBA funding paths only where evidence is complete#
If Virtual Accounts (VBA) are enabled, evaluate them as a separate funding path for specific flows. Compare like-for-like cohorts, same corridor, provider, and period, and track funding arrival time, unmatched cash incidents, manual interventions, payout holds, provider-reference match rate, and downstream delay. If multiple operating changes happened at once, report VBA results as an observed association rather than a causal routing conclusion.
Route decisions should be based on failure-adjusted corridor evidence, not fee cards alone. Keep the monthly table concise enough for management reporting and complete enough for third-party risk review and internal audit.
If payout timing decisions depend on liquidity, Cash Flow Forecasting for Payment Platforms for Payout Go/No-Go Decisions covers that side of the model.
Use the Payment Fee Comparison for a sensitivity scenario with your verified inputs. A calculator does not validate provider fees, eligibility or actual recipient receipts; reconcile those separately.
Set batching and threshold rules that reduce cost without harming reliability#
Allow batching only where comparable records show a benefit and the recipient’s agreed schedule and legal requirements permit it. A batch containing 100 recipients normally still has 100 recipient-payment units; one API request does not mean one payout unit. Verify whether pricing is per call, per item, percentage-based or a combination before predicting savings.
Set rules at the same decision grain you used for routing#
Set policy at the same unit of analysis you used for routing, rather than with one global batching rule. Keeping the same unit of analysis preserves comparability with your evidence.
| Rule row field | Include |
|---|---|
| corridor and provider, or provider group | Include in each rule row |
| payout size band | Include in each rule row |
| cutoff window and release timing | Include in each rule row |
| default release mode | mandatory batch, optional batch, or single release |
| current True Cost per Payout | Include current True Cost per Payout |
| completed volume for the review period | Include completed volume for the review period |
| exception rate and time to final status | Include both measures |
| baseline measurement date and policy owner | Include both fields |
Those are the minimum fields for each rule row.
Only promote a rule to production when it traces to a documented baseline measurement and underlying operational evidence.
Tie thresholds to per-unit economics, not instinct#
Review low-value payouts using actual revenue, cost and promised service. A $1 fixed fee on a $5 payout is 20% of value, while the same fee on $100 is 1%; that does not by itself authorize withholding a due balance. Thresholds can accumulate recipient obligations and delay arrival, so model both the saved cost and the contract/support consequences.
Use two checks in threshold review:
- does this value band have a True Cost per Payout that is out of proportion to the value delivered?
- does it add a large share of completed volume without improving overall economics?
If cost is high relative to service revenue or payout value, compare lawful batching, route improvements and pricing changes. Do not impose a threshold simply to improve the denominator; unresolved recipient balances remain obligations.
Count usage-based request costs only when your provider/tool contract actually charges for them. Track additional status retrieval and reconciliation work even when the API call itself is free. Efficient retrieval still needs reliable recovery of uncertain outcomes; reducing checks must not increase duplicate or unresolved payouts.
Keep threshold and batching logic under the same policy ownership for consistent approvals. For deeper threshold design, see Publisher Payment Thresholds: How to Set Minimum Payout Limits That Reduce Cost Per Transaction.
Change batch intensity based on volume and exceptions#
Adjust batch intensity as a cost-performance-reliability-security tradeoff, not as a fixed rule. Use current volume, exception patterns, and operational stability as inputs when deciding whether to batch more, batch less, or use single release.
Treat larger batches as higher-consequence decisions. They can lower cost per unit in some cases, but they can also increase the impact of operational failures.
Review against a baseline and refresh on a regular cadence#
Record the pre-change baseline before deployment, then compare the same policy and cohort characteristics after the change. Keep both old and new calculation versions if an allocation or unit definition changes. A post-change number alone cannot identify an improvement.
Keep the success criterion explicit: lower unit cost with stable completion quality. If cost drops while exceptions, holds, or delay worsen, narrow or roll back the rule by corridor.
Run a monthly close sequence with clear owners and checkpoints#
Finalize the cost KPI after fixing the reporting window, reconciling material count/cost variances, applying approved accruals and signing off the allocation coverage. Maintain tax/reportability work as a separate compliance control where applicable; it does not determine the cost denominator. Open material source gaps keep the KPI provisional, while immaterial exceptions can be disclosed under the approved close policy.
| Checkpoint | What to do | Key record |
|---|---|---|
| Freeze period evidence | Lock reporting window, extraction timestamp, unit policy and allocation version | Period label, extraction timestamp, and version name |
| Reconcile variances | Resolve material count/cost mismatches; retain owner, quantified impact and disclosed immaterial items | Owner, cause category, expected resolution date, and whether current-period KPIs are affected |
| Post accrual adjustments | Use accrual accounting so events are recognized when they occur, not only when cash moves | Tie material adjustments back to dated support |
| Applicable compliance status | Review required payment classifications and documents separately from cost KPI signoff | Restricted record reference, reviewed status and next action; no broad tax-ID distribution |
Freeze the period and extract the same evidence every month#
Lock one reporting window, then pull the same core records in the same order each month.
Require each extract to carry a period label, extraction timestamp, and version name so finance and ops are working from the same cut. If source data updates after cutoff, flag it as post-cutoff input rather than silently replacing close files.
Reconcile variances and assign each break to one owner#
Reconcile payout activity across systems, then log each variance with one clear owner. Use consistent cause categories so unresolved items can be tracked to closure instead of sitting as general investigations. Before signoff, each open item should show owner, cause category, expected resolution date, and whether current-period KPIs are affected.
Post accrual adjustments before publishing final KPIs#
Post close adjustments using accrual accounting so events are recognized when they occur, not only when cash moves. Apply accruals after variance review is stable enough to support period matching, then tie material adjustments back to dated support.
For a deeper refresher on period matching, see What Is Accrual Accounting? Why Payment Platforms Must Match Revenue and Payout Costs in the Same Period.
Add a tax-reportability checkpoint without exposing PII in ops reporting#
Where U.S. reporting applies, determine the responsible filer, payment type, payee status, method and tax year under IRS contractor reporting guidance. Other countries and payment roles have different obligations. A routing record alone does not decide whether a platform is the filer.
Track operational status fields such as classification reviewed, reportability pending, and tax form on file, rather than broad distribution of raw tax IDs or document images in KPI reporting.
Use the guidance for the actual tax year and form. Do not use a 2023 transition fact sheet as today’s universal threshold or assume all corporate payments are exempt. Keep reportability status and restricted document evidence in the compliance workflow, and allocate any resulting service work consistently; do not block the arithmetic of a cost KPI merely because an unrelated filing decision is pending.
Spot the reporting mistakes that make costs look better than reality#
The biggest risk after a clean close is cosmetic reporting: mixing unlike metrics so payout execution appears healthier than it is. The fix is straightforward. Keep each metric tied to its own purpose and keep cost inclusion rules stable.
Separate payout cost from Gross Margin#
Do not use Gross Margin as a proxy for payout efficiency. Gross margin reflects overall business economics, while True Cost per Payout should reflect per-transaction execution cost. Keep them separate so changes in sales mix or pricing do not mask operational cost movement.
Keep CAC Payback Period out of payout reporting#
CAC is acquisition sales and marketing spend divided by new customers acquired under the defined cohort. CAC payback measures how long customer contribution takes to recover that acquisition cost. Neither is a substitute for payout cost. Keep acquisition spend outside the payout-service numerator unless a separately named business-wide allocation deliberately includes it.
Include hidden and rework costs in the numerator#
Excluding real cost drivers makes per-unit costs look artificially low. Unit economics is understated whenever costs are omitted, similar to excluding returns, discounts, or payment processing fees in other models. Use one written rule that consistently includes recurring execution and rework costs in the numerator.
Handle delayed updates with one period rule#
Use one documented rule for late outcomes and costs. Preserve the published as-of pack, log later returns/fee adjustments and follow the approved material correction or restatement policy. Show older-cohort repair costs in the period incurred and a cohort follow-up when useful; do not count a reissue as a second first completion just because it crosses month-end.
Related: Spend Analytics for Platforms That Turns Payout Data Into Cost Decisions.
Execute a first 30-day implementation plan#
Use the next 30 days as an illustrative implementation schedule, adapting it to your records and risk. Establish the necessary metric and legal/reliability checks before using a new routing or threshold rule for a broad rollout. A company does not need an Internal Audit department to calculate the metric; assign competent preparation and review owners.
Lock the policy in Week 1#
Document how you define Completed Payout, your cost buckets, and your allocation approach. Keep it short, versioned, and dated. Your checkpoint is simple: can finance and payments ops read it and reach the same denominator and cost boundary without a meeting?
Define names precisely. A valid cost with an unresolved driver stays visible in an unallocated bridge rather than disappearing from the report. A metric with material unknowns remains provisional, with the missing record and next action identified.
Connect the records in Week 2#
Extract payout activity from your Ledger and provider systems, then join records with the same references used in reconciliation. Treat the Ledger as the financial account record, not a side report. Check whether your event history is complete enough to explain final states and exception paths.
Verify coverage before speed: sample payouts and trace each one across ledger entry, provider status, and event history. Then review retries and exception handling so blocked duplicates do not hide operational review work.
Publish a draft view in Week 3#
Publish a draft metric view with provider-routing cuts and an explicit exception-cost overlay where relevant. Keep the first cut narrow and readable. Look for distortions, such as a segment appearing cheap only because failure handling sits outside the model.
Formalize governance in Week 4#
Set the monthly review cadence, provisional KPIs, and escalation triggers for threshold, routing, and batching decisions. Keep trigger values tailored to your institution's risk profile. Lock ownership now: who prepares the pack, who challenges it, what review scope applies, and what gets escalated into management and board reporting when costs move without a clear cause.
Turn this into your monthly operating checklist#
Use this as a monthly close discipline, not a dashboard refresh. If a number cannot be tied to source records or a documented policy, keep it provisional until the gap is resolved.
Lock one stable definition#
Lock one stable definition for your primary unit metric and publish it in the KPI pack every month. If you use Completed Payout internally, treat it as an internal reporting label; there is no universal payout definition established here.
State what is included, what is excluded, and how reporting-period cutoffs are handled. That keeps finance, ops, and product on the same denominator.
Reconcile the core control set#
Reconcile the completed-obligation count, payout attempt/status population, actual fees/credits, direct handling, FX treatment and shared service-cost pools. Keep marketing spend and customer LTV in the growth scorecard. Quantify any source gap so a known expense is not silently excluded from the payout report.
Maintain a variance list with item count, value impact, and owner for each open break. If records conflict, publish with a caveat or hold the metric as draft.
Calculate the fully loaded number#
Show variable/direct cost per completion and the fully loaded service measure side by side. Include allocated overhead once, and bridge known unallocated service costs. Higher volume can absorb fixed overhead differently from changing variable expense; do not infer incremental losses from the fully loaded rate alone.
Add a revenue/contribution view only with the same payout population and a clear revenue boundary. The amount paid to recipients is principal, not platform revenue. Keep funding transfers, returned principal, fees, credits and actual unrecovered losses in their proper categories.
Apply allocation rules consistently#
Apply Accrual Accounting and your allocation rules consistently, and keep a changelog when rules change. Shared costs belong in the core metric only when the allocation driver is documented, repeatable, and reviewable.
Include the current method, effective month, and what changed from the prior version. For period-matching context, use this accrual accounting guide.
Review corridor-level routing outcomes#
Review corridor-level Provider Routing outcomes (where enabled) and make one explicit monthly action. Treat payout-specific routing, batching, threshold, and settlement assumptions as internal and data-dependent; validate corridor-level payout rules against your own operational records.
Do not treat visible fee movement as the whole story. Pair route results with loaded economics and documented exceptions from the same period.
Share one final pack#
Share one final pack across finance, ops, and product with assumptions, caveats, and next-step decisions on page one. The pack should show where economics break, not only whether a top-line KPI moved.
Include the current metric definition, loaded-cost view, open reconciliation breaks, any Accrual Accounting rule changes, and the operating action selected from routing review.
If payout cadence is driving cost or exception volume, Payment Scheduling for Platforms: How to Build Flexible Payout Calendars for Contractors is the more practical next step.
Frequently Asked Questions
What costs should be included in True Cost per Payout?
Include actual rail/provider fees net of credits, FX execution cost under your stated method, failed-attempt/return charges, direct handling and defensibly allocated payout-service overhead. Exclude recipient principal and acquisition spend from the execution scope. Show known unallocated service cost separately and label material gaps; do not call a partial rate fully loaded.
How should we define a Completed Payout when statuses are asynchronous?
Choose a rail-specific observed outcome and count stable recipient obligations once at first qualifying completion, as of a stated cutoff. Accepted submissions and repeated callbacks are not completions. Link returns and reissues to the same obligation, preserve published history and report material corrections; provider success can later be corrected.
Do compliance costs like KYC and AML belong in per-payout economics?
Yes, payout-specific compliance work and an allocated share of ongoing monitoring can belong in a fully loaded service view. A direct payout gate is not required for all shared costs. Use documented time/activity drivers, avoid double counting and keep an unallocated-cost bridge if the basis is unresolved. Keep restricted case details outside broad KPI distribution.
How do failed payouts and retries change the metric in practice?
Their fees and handling costs enter the numerator even when no obligation completes. Count attempts separately from unique completed obligations. Recover unknown outcomes before retrying; callbacks can repeat without a new economic attempt. A higher failure burden can raise cost per completion and leave a backlog that must be reported alongside the rate.
How can we compare providers fairly across corridors with different FX behavior?
Compare matched corridor, value band, recipient method, currency and funding paths with the same unit definition and cutoff. Record actual source debit, recipient net, quote/rate timestamp, explicit fees, completion rate, delay and repair cost. Do not subtract an embedded FX spread again if it is already reflected in the converted amount.
Should payout thresholds and batching be optimized for cost, speed, or both?
Optimize cost and delivery reliability within agreed recipient terms and legal requirements. Verify actual per-item versus per-call pricing, compare matched cohorts and measure arrival delay and exceptions alongside cost. A batch reduces overhead only when the cost evidence supports it; it does not reduce the number of recipient-payment units.
What is the minimum data required to produce an audit-defensible monthly number?
Use stable obligation/attempt IDs, amount and currency, provider IDs, authoritative status history and cutoff, fee/credit records, journal/bank references, FX inputs/results where relevant, handling costs and allocation versions. Reconcile totals to source invoices and operating expense pools. The proposed fields are a practical management design, not a universal audit certification.
Researched and edited by the Gruv editorial team. Gruv builds cross-border billing, payouts, and finance-operations software for global businesses.
Sources
Educational content only. Not legal, tax, or financial advice.
Related Posts

The Freelance Payment Penalty: A Modeled Audit of Platform Fees, FX Spreads, and Payout Delays
The money rarely disappears through a single, easy-to-spot fee. The real loss is stacked. A marketplace takes its commission, a processor adds a charge for international cards, a bank or payment company converts the currency at a spread, a platform holds the funds before release, and a wire sheds a little to intermediaries on the way in. Each layer looks defensible on its own, but the worker feels the combined result as a smaller deposit and a later payday.
How to Respond to a Subpoena for Business Records
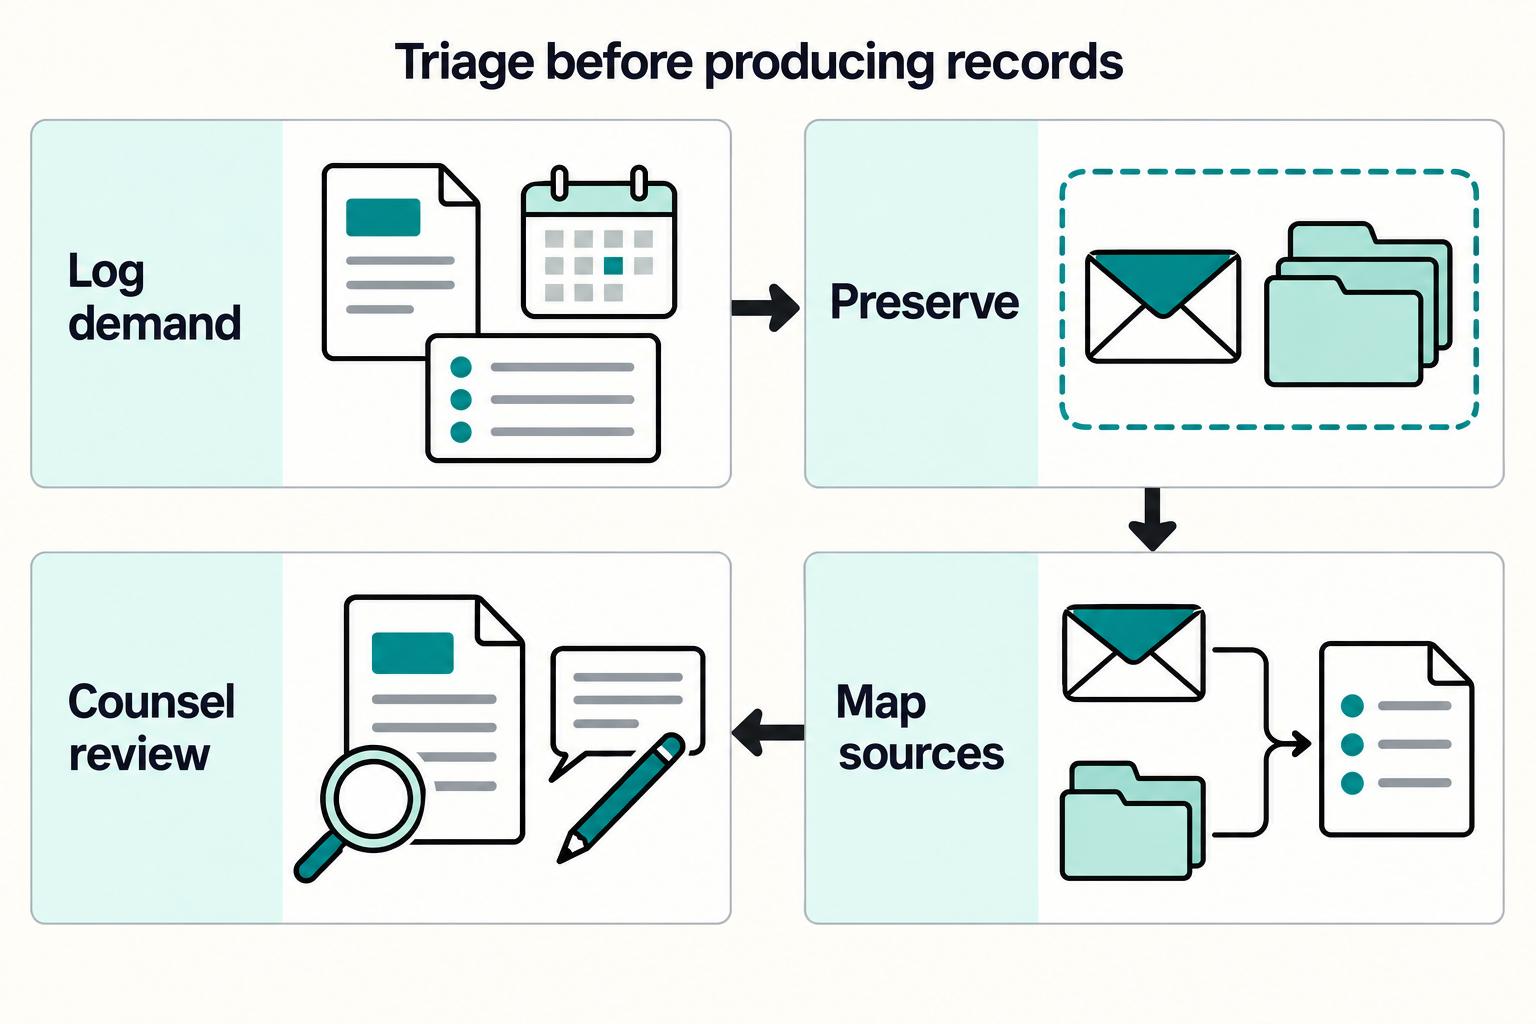
Move fast, but do not produce records on instinct. If you need to **respond to a subpoena for business records**, your immediate job is to control deadlines, preserve records, and make any later production defensible.
A US Expat's Guide to Investing in UCITS ETFs to Avoid PFIC Issues
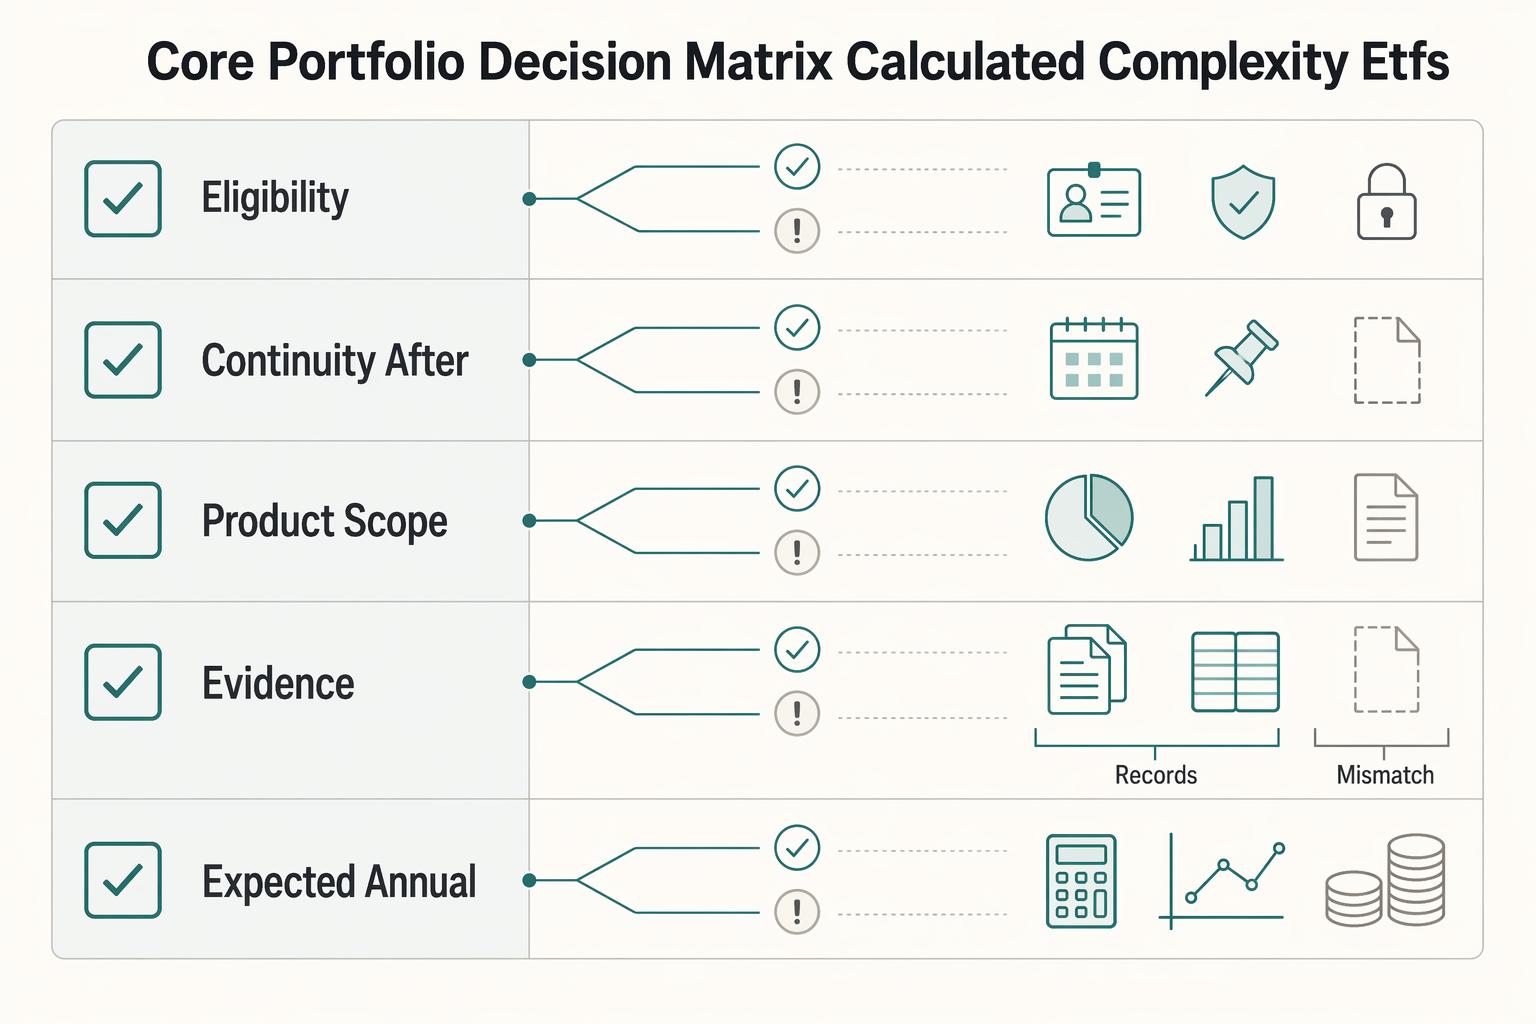
The real problem is a two-system conflict. U.S. tax treatment can punish the wrong fund choice, while local product-access constraints can block the funds you want to buy in the first place. For **us expat ucits etfs**, the practical question is not "Which product is best?" It is "What can I access, report, and keep doing every year without guessing?" Use this four-part filter before any trade: