
Quick Answer
Calculate payment processing fees by modeling them as one line in a full Total Cost of Ownership framework. Use your real transaction mix by payment type, geography, payouts, and accounts, then add setup, implementation, maintenance, support, compliance, tax handling, downtime, and personnel costs over the same three to five year horizon. Compare every option with the same scope and assumptions.
Model Total Cost Before You Compare Providers#
If you compare options on processing rates alone, your cost model is incomplete. The better lens is Total Cost of Ownership (TCO): the full financial impact over time, not just the visible fee line on a pricing page or invoice.
Step 1 Reframe the decision around full cost#
Treat Payment Processing Fees as one input, not the verdict. They are easy to see, so they often get most of the attention, but they do not tell you the full economics.
A workable TCO view includes both visible and hidden costs. That means not only recurring platform charges, but also initial setup costs and ongoing expenses such as implementation work, maintenance, upgrades, support, and personnel effort.
What looks cheaper upfront can become more expensive over time. Throughout this guide, the discipline is simple: compare like for like, over the same horizon, with the same scope.
Step 2 Connect fees to operating reality#
Payment cost is not just a finance line item. Operating choices move total cost, and those effects belong in the same model as processing rates.
This guide ties fee math to day-to-day execution so the tradeoffs are visible before you commit. Slow performance and outages belong here too: lost revenue during those periods is part of the downside and should be modeled as a failure-mode cost.
If you are a founder, product lead, revenue owner, or finance operator, the goal is one decision with fewer blind spots, not a prettier spreadsheet.
Step 3 Set an apples-to-apples comparison rule#
Before you compare vendors or pricing models, document the method and keep it constant. There is no single universally agreed TCO method, so consistency across options matters more than claiming one mandatory formula.
One documented approach is to add setup and ongoing costs, then divide by expected lifespan to annualize. Whether you use that method or another, apply it the same way across every option.
Use the same fixed horizon for each option, often 3 to 5 years in platform comparisons, and keep the same major cost lines in scope. By the end of this guide, you should have a defensible TCO view for comparing options and making vendor decisions.
What to prepare before you start the calculation#
Build the input pack before you run any fee math. Otherwise, your TCO model will rest on assumptions you have not verified.
Step 1 Pull representative transaction history#
Start with a representative slice of your own transaction data and break it out by payment type and geography. Keep card volume, bank transfer volume, payout counts, and monthly active accounts visible so the cost drivers do not disappear into one blended rate.
If you cannot explain where major processing dollars came from by payment type and location, stop and fix the data before you compare options.
Step 2 Gather every commercial document#
Collect current contracts, invoices, order forms, and pricing pages for processing rates, payout fees, and related add-ons. For Stripe, include the fee lines that can materially change outcomes: 2.9% + 30¢, +1.5% for international cards, +1% for currency conversion, 0.8% ACH Direct Debit with a $5.00 cap, and Connect pricing such as $2 per monthly active account and 0.25% + 25¢ per payout sent.
| Fee example | Applies to | Note |
|---|---|---|
| 2.9% + 30¢ | Processing rates | Can materially change outcomes |
| +1.5% | International cards | Can materially change outcomes |
| +1% | Currency conversion | Can materially change outcomes |
| 0.8% with a $5.00 cap | ACH Direct Debit | Can materially change outcomes |
| $2 | Per monthly active account | Connect pricing example |
| 0.25% + 25¢ | Per payout sent | Connect pricing example |
| 3.5% | Per successful transaction | Managed Payments adds this on top of standard processing fees |
Watch for stacked pricing: Managed Payments adds 3.5% per successful transaction on top of standard processing fees.
Step 3 Assign owners before assumptions spread#
Assign a clear owner to each assumption set so each line item has accountability.
For each assumption, attach evidence such as an invoice, contract clause, or settlement export. That one step makes later review much faster.
Step 4 Freeze the comparison set#
Lock the shortlist up front, for example your current stack vs Stripe plus required add-ons vs another shortlisted option, so you do not move the goalposts later. Before review, verify provider pricing again for each relevant country, since country-specific pricing can override general fee tables.
If cross-border acceptance or payouts affect your fee model, see Multi-Currency Payment Processing for Platforms: How to Accept and Disburse in 50+ Currencies.
Set scope and decision horizon before touching fee rates#
Fee-rate comparisons are most useful when every option is modeled inside the same Total Cost of Ownership (TCO) scope and the same decision horizon.
Step 1 Lock one decision horizon#
Use one horizon across all scenarios, then calculate both annual cost and full-horizon TCO from that same model. This keeps near-term budget impact visible without hiding lifecycle costs like setup, integrations, maintenance, support, and staffing.
Step 2 Define scope in writing before comparing totals#
Write an explicit included and excluded scope and apply it to every option. Include both obvious and less visible lifecycle line items, not just headline fees, and keep that scope consistent across scenarios.
Step 3 Pull downstream cost shifts back into the model#
If one option lowers a visible payments line but creates work in another system, bring that cost back into the model. Extra accounting cleanup, reconciliation effort, or Enterprise Resource Planning (ERP) maintenance can still belong in TCO when the option creates that work. This is a common failure mode in fee-only comparisons: spend often moves instead of disappearing.
Step 4 Stop if scope drifts across options#
If scope differs, pause and normalize it before you compare totals. A decision is only comparable when cost and usage are evaluated in one decision frame with consistent unit economics.
Use a simple checkpoint before review: each line item should have clear internal pricing, consistent unit economics, and a FOCUS-aligned dataset for scenario modeling. For a step-by-step walkthrough, see ACH Payment Processing Platforms for U.S. Collections and Payouts.
Build your transaction cost model from real payment mix#
Build your fee model from the transaction mix you actually process, not one blended rate, so decision-makers can see where cost movement is really coming from.
Step 1 Segment transactions by the variables that change cost#
Start with transaction groups instead of a single monthly total. For each group, track payment method, authorization outcomes, batching pattern, and chargeback or fraud activity so the model reflects how costs and operational risk vary in practice.
| Model dimension | Why it belongs in the fee model | Best source to pull first |
|---|---|---|
| Payment method | Different methods can create different cost and operational patterns | Processor export by payment method |
| Authorization outcomes | Approval and decline outcomes determine what moves forward in processing | Authorization logs and decline reports |
| Batching pattern | Batching is an explicit checkpoint that affects how transactions are grouped for processing | Processor batch reports |
| Clearing and funding status | Clearing verifies and settles transactions, while funding transfers money to your account | Settlement and funding reports |
| Chargeback and fraud activity | Chargebacks and fraud prevention are common operational challenges that affect total cost | Dispute and fraud reports |
You usually do not need one row per transaction. Group by stable operating buckets, and keep segments separate when authorization outcomes or dispute behavior differ.
Step 2 Break out fee components instead of relying on one blended average#
Where contracts and statements allow, separate quoted terms from observed outcomes. Keep blended averages for reporting, but use component-level views for decisions so you can tell what is changing because of mix and what is changing because of vendor terms.
If full breakdowns are not available, separate what is observed from what is assumed. A practical structure is quoted component, observed component, assumption note, and owner for each segment.
Handle assumptions carefully because they can move with payment mix. If the same assumption is used across segments with different behavior, flag it before review. For a refresher on fee mechanics, see A deep dive into 'interchange fees' and how they affect your pricing.
Step 3 Reconcile to historical processor data before using any calculator#
Use your own history as the base case. Tie modeled volumes and costs to processor exports, invoices, and settlement reports, and check for gaps across authorization, batching, clearing, and funding.
Treat calculator tools as directional sanity checks, not the source of truth for the final model. If calculator output conflicts with your historical model, review the assumptions before you change the conclusion.
Keep evidence traceable. For each non-observed assumption, attach the processor statement, contract page, invoice sample, export date range, and a named owner.
Step 4 Stress test mix shifts before presenting Payment Processing Rates#
Run sensitivity bands based on mix shifts you already see, including a base case and one or two realistic mix-shift cases. If chargeback or fraud pressure moves seasonally, model those shifts too, then show the impact on both total fees and effective Payment Processing Rates.
The key signal is not only which option looks cheaper in one snapshot, but how costs move when behavior changes. Finish this step with a model that ties back to historical data, makes assumptions explicit, and surfaces mix risk before vendor comparison.
Add the non-fee costs competitors usually leave vague#
Once the transaction-fee model reflects your real payment mix, add the non-fee costs that still affect margin. If you leave them out, your Total Cost of Ownership (TCO) view can favor the option with the cleanest price sheet instead of the option your team can actually run well.
Step 1 Quantify labor that exists because the payment flow exists#
Treat payment-flow labor as a real cost line from the start. Include implementation and ongoing work across training, support handling, incident response, upgrades, and integration maintenance.
These are soft costs, harder to measure than processor fees, but still part of TCO. Use internal evidence such as recent tickets, incident reviews, sprint history, and SOWs, and require each labor line to include an owner, estimate, and evidence note.
| Cost bucket | Typical payment-specific examples | Best evidence to attach |
|---|---|---|
| One-time implementation labor | Integration setup, training, migration testing | Tickets, sprint history, vendor SOW, test plan |
| Ongoing maintenance labor | Upgrades, bug fixes, integration mapping changes | Change log, backlog history, maintenance tickets |
| Support and incident labor | Payment failures, escalations, outage response, manual recovery | Support tags, incident log, postmortems |
Hidden costs are easy to miss when teams focus only on visible price lines, so do not treat labor as background noise.
Step 2 Add recurring spend outside the transaction line#
Model recurring non-transaction spend as explicit lines, not footnotes. Include software subscriptions or modules where applicable, plus the work required to keep integrations stable.
This is where comparisons often drift. A lower headline price can still come with higher recurring software and maintenance burden. In TCO terms, implementation, training, upgrades, and integrations belong in the same decision model.
If a recurring line is not tied to an invoice, contract, or renewal record, mark it as an assumption and assign an owner to validate it.
Step 3 Price downtime and performance drag from your own history#
Include downtime and performance drag directly in TCO, using internal data rather than vendor claims. Base estimates on your own incident history, support volume, and recovery effort.
For each relevant incident window, estimate productivity impact, incremental support load, and manual recovery work. If your data is incomplete, use a conservative range and label it as an assumption.
Step 4 Separate migration cost from ongoing run cost#
Keep one-time migration costs separate from ongoing run costs so the model stays useful after launch quarter. Migration usually covers implementation, integration setup, training, and cutover support. Ongoing run covers subscriptions, maintenance, support handling, and recurring integration upkeep.
Show both categories across the same decision horizon. That makes the tradeoff visible. One option may be heavier to switch into but cheaper to run, while another may launch quickly but stay expensive to operate. Related: How to Calculate the 'All-In' Cost of an International Payment.
Account for compliance and tax gates that change real unit economics#
Compliance and tax gates belong in your TCO model as operating cost, not background overhead. If a provider charges more but removes enough compliance work, compare net operating cost before you rule it out.
| Item | Where to model it | Use internal evidence from |
|---|---|---|
| KYC | Onboarding, first payment, payout release, account changes, and exception handling | Your own logs and tickets |
| KYB | Onboarding, first payment, payout release, account changes, and exception handling | Your own logs and tickets |
| AML | Onboarding, first payment, payout release, account changes, and exception handling | Your own logs and tickets |
| W-8 | Collection, correction, and support effort | Internal counts, tickets, and finance effort only |
| W-9 | Collection, correction, and support effort | Internal counts, tickets, and finance effort only |
| Form 1099 | Collection, correction, and support effort | Internal counts, tickets, and finance effort only |
Step 1 Map each compliance gate to where money movement slows#
If your flow includes Know Your Customer (KYC), Know Your Business (KYB), or Anti-Money Laundering (AML) checks, map them to lifecycle points you already modeled, for example onboarding, first payment, payout release, account changes, and exception handling. Use your own logs and tickets for timing and cost signals. This guide does not support generic KYC, KYB, or AML timing or per-case benchmarks.
For each gate, record:
- Owner
- Trigger event
- Current handling method
- What happens when review is incomplete or delayed
Then translate the observed impact into labor cost, delayed revenue recognition, or support burden.
Step 2 Add tax-document handling as its own line item#
If your flow includes W-8, W-9, or Form 1099 work, model it explicitly as collection, correction, and support effort. This guide does not support generic workload assumptions here, so use internal counts, tickets, and finance effort only.
If a number is not supported yet, keep it as an assumption with a named owner to validate.
Step 3 Model VAT/GST responsibility in cross-border flows#
For cross-border digital sales, treat VAT/GST responsibility as a core TCO driver. OECD research indicates that more jurisdictions have pursued measures involving platforms in VAT/GST collection. That includes approaches that can make platforms liable, plus data-sharing and authority-platform cooperation mechanisms.
For each jurisdiction in scope, answer:
- Is the platform liable for VAT/GST in this model?
- Is data sharing required?
- Is authority-platform cooperation required operationally?
Use this as a decision artifact, not a footnote. The same OECD source also notes that two-thirds of cross-border e-commerce goods sales are made through online marketplaces, so this exposure is material for marketplace-style models.
Step 4 Compare compliance offload against the higher-fee option on net cost#
Evaluate each option as:
- Fee + internal compliance and tax operating burden
- Fee + reduced internal burden after offload
Support each option with a compact evidence bundle: contract language on responsibility split, internal workload signals, support tickets tied to verification or tax friction, and known rule-review triggers. Compliance requirements can change, so keep update triggers visible rather than assuming a static operating baseline. Related reading: How to Build a Deterministic Ledger for a Payment Platform.
Model architecture choices that move cost across the lifecycle#
Architecture should be chosen on lifecycle TCO, not on the lowest visible fee line. Compare each model by where cost lands across implementation, steady-state operations, and future change effort.
Step 1 Compare options by cost location#
Put card-first, bank-transfer-first, hybrid (VBAs + card rails), and any MoR option in one view, then test each against your own operating data.
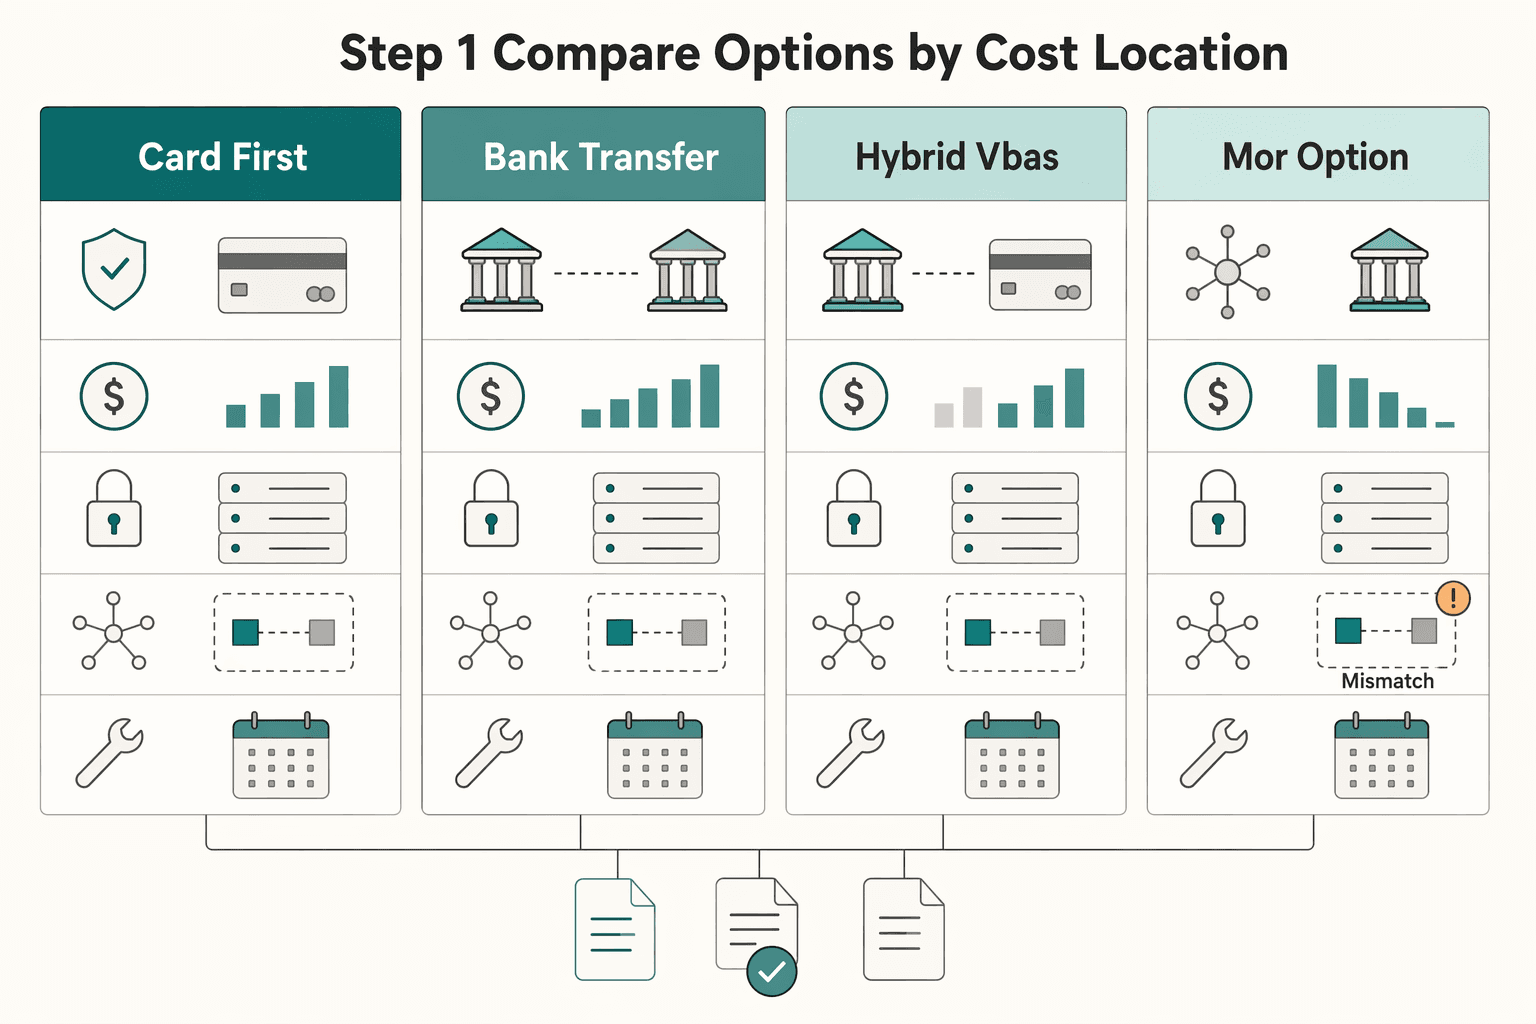
| Architecture choice | What to evaluate first | Cost shift to test | Verification checkpoint |
|---|---|---|---|
| Card-first | Checkout flow and acceptance path | Fees and downstream operating load | Does acceptance performance in your data offset total lifecycle cost? |
| Bank-transfer-first | Collection and payment-state handling | Visible rail cost and handling work | How much tracing, mismatch handling, and support work appears in your logs? |
| Hybrid (VBAs + card rails) | Routing logic by use case | Integration scope and exception paths | Can collection, settlement, and payout events be mapped cleanly into ledger/ERP? |
| MoR option | Responsibility split in contract | Provider cost and internal work offload | What responsibilities actually move, and which remain with your team? |
Before you compare providers, split each option into mandatory and variable lines. Keep licence, transaction, and core platform costs separate from integrations, development, and maintenance so headline pricing does not distort the decision.
Step 2 Treat payout design as a potential cost center#
Payout design can shift indirect cost. Model manual payouts and automated payout batches with the same rigor, including failure handling, retries, and reconciliation.
Track each design with a small evidence pack from internal reports:
- Initiation source
- Payout or batch identifier
- Failure reason or return code
- Retry owner and retry rule
- Final match status in ledger/ERP
If failed payouts cannot be traced cleanly through correction and support resolution, your TCO model may be missing indirect operating cost.
Step 3 Price direct, indirect, and intangible costs together#
Use explicit TCO lines:
- Direct costs: fee lines, implementation, maintenance
- Indirect costs: training, downtime, performance inefficiencies, and other operating effort
- Intangible costs: impacts such as compliance risk
Also price changeability. A tightly interconnected setup can look cheaper early, while future changes become costly. A more composable setup can require higher upfront investment but lower future-change effort. Do not assume either one is always cheaper.
Step 4 Stress-test cross-border and multi-currency exception load#
For cross-border or multi-currency volume, test whether an architecture removes enough exception handling to justify its price. Use internal evidence from finance exceptions, support tickets, and reconciliation breaks, then verify whether exceptions are reduced or only shifted between teams.
End with a short decision note per option:
- Where cost moved
- What evidence supports it
- What could fail in production
That gives you a defensible lifecycle comparison across card-first, bank-transfer-first, hybrid VBA and card, and MoR paths.
Turn the model into pricing and margin decisions#
The model matters when it changes a pricing or margin decision. Once lifecycle costs are mapped by architecture, turn them into decision units and choose based on retained economics, not headline rates.
Step 1 Convert lifecycle totals into decision units#
Normalize every scenario to a common basis before you compare options. Translate each one into common decision units, such as cost per transaction and margin after payments, using the same horizon, volume assumptions, and scope.
Keep major cost lines separate while modeling so you can see what is actually driving the result:
- Payment processing fees and other direct payment costs
- Platform or core costs
- Implementation and ongoing operating effort
- Payout handling and reconciliation workload
Use a simple checkpoint: each unit view should roll back to the same Total Cost of Ownership (TCO) total for that scenario.
Step 2 Set your action triggers before reviewing results#
Define your target margin band first, then classify each scenario as inside, near, or outside that band. If projected TCO pushes a scenario outside the band, adjust the inputs now rather than carrying the gap forward.
Typical levers:
- Change pricing, take rate, or packaging
- Simplify payment or settlement-flow design
- Reroute only where lower rates still beat added operational burden
Step 3 Compare scenarios by retained margin, not fee headlines#
A lower quoted rate does not automatically mean better economics. Quoted processing rates can sit around 2-3.5% per transaction plus a fixed fee. Effective cost can move closer to about 2-5% of GMV once payout and gateway costs are included, and a 10% commission can compress to about 4-6% retained economics. Treat these as directional pressure tests, not universal benchmarks.
| Measure | Range | Qualifier |
|---|---|---|
| Quoted processing rates | 2-3.5% per transaction plus a fixed fee | Directional pressure test |
| Effective cost | About 2-5% of GMV | Once payout and gateway costs are included |
| 10% commission | About 4-6% retained economics | Directional pressure test |
For each scenario, write a short decision note:
- What improved in unit economics
- What operational burden increased
- What is most likely to break as volume, refunds, or payout complexity rise
Watch settlement-flow branching closely. More steps across capture, split, payout, and reversal can raise reconciliation complexity even when headline rates look attractive.
Step 4 Tie the pricing choice to roadmap priorities#
Pick the option that fits both margin goals and the roadmap. A higher-rate design may still be the better choice when it lowers reconciliation complexity and day-to-day operational burden. A lower-rate path may be stronger when operations are stable and the team can absorb added work.
In the approval note, state the priority you are optimizing for, the payment design you chose, and the cost tradeoff you are accepting on purpose.
Compare vendors without getting trapped by headline claims#
If vendors are not modeled with the same scope, horizon, and growth assumptions, you do not have a usable comparison.
Step 1 Lock one comparison basis before reviewing vendor claims#
Fix one horizon across every option. A 3-5 year window is a common TCO frame, but consistency matters more than the exact length. If one model includes migration, integration, and run costs while another shows only year-one subscription, the "cheaper" result is not decision-grade.
Keep one shared demand model too: the same transaction volume, growth expectations, channels, and geographies. TCO should include direct and indirect costs over a defined period, not just purchase price, so model visible and hidden costs together.
Step 2 Use one table that forces full-cost visibility#
Do not stop at platform subscription and processing lines. Include implementation and integration work, ongoing maintenance, and failure-mode costs like revenue loss during outages or slow performance. Some models look cheaper only because spend moves into internal people and operations work.
| Cost line | Hold constant across vendors | Evidence reference |
|---|---|---|
| Platform Subscription Fees | Plan scope, add-ons, contract horizon | Pricing sheet, contract draft, invoice |
| Payment Processing Fees | Transaction mix, countries, currencies, refunds, disputes | Pricing exhibit, assumptions file |
| Integration burden | Checkout, payouts, ERP/POS touchpoints | Engineering estimate, solution notes |
| Maintenance and operations burden | Ongoing workload and exception types | Support data, ops estimate |
| Outage/slow-performance cost | Traffic and conversion assumptions | Incident history, conversion impact estimate |
If you need more structure, use a vendor scorecard format so each vendor is graded against the same criteria instead of one headline rate.
Step 3 Treat outcome marketing as a hypothesis until method is clear#
Case-study outcomes, including percentage claims around Shopify Plus, can be useful prompts, not final evidence. If methodology, scope, and assumptions are not clear enough to reproduce, keep those numbers in a "hypothesis" lane.
Before leadership review, run a traceability checkpoint: assign source owners and backing references for the major modeled lines. If support is missing, mark that line provisional instead of treating it as decision-ready.
Before leadership review, run the same assumptions through one standardized worksheet so rate and ops costs stay comparable: Use the payment fee comparison tool.
Common mistakes and how to recover quickly#
A common failure mode is relying on headline fees while missing cost categories. In merchant processing, high volume and thin margins mean small omissions can push you toward the wrong decision.
Step 1 Rebuild the fee model by mix, not one blended rate#
A single blended rate can be directional, but it is not enough on its own for a full-scope decision. Recover by segmenting Payment Processing Rates by the mix drivers that change cost in your business: payment type, channel, geography, currency, refunds, and disputes.
Use scenario bands from the same demand base, for example recent actual mix and plausible mix shifts, so leadership sees a range instead of one false-precision number. Keep each segmented line traceable to transaction exports and pricing exhibits, contracts, or invoices. If it is not traceable, mark it provisional.
Step 2 Add compliance and tax operations as explicit cost lines#
Compliance and tax handling can create operating work that is easy to miss in headline pricing. Recover by adding explicit lines for the compliance and tax-document workflows that apply to your setup, including collection, correction, exception handling, and support.
Under a full Total Cost of Ownership (TCO) view, a higher visible fee can still be the better choice if it removes enough manual work. The reverse can also be true. Build these lines from evidence you already own, such as operational queues, support cases, and SOPs, so the model stays traceable.
Step 3 Count internal labor tied to ERP and reconciliation#
If vendor tooling is in the model but internal labor is not, the comparison is incomplete. Recover by adding engineering, finance ops, and support effort tied to ERP mapping, payout reconciliation, exception research, and recurring maintenance.
This is also where risk shows up. Weak controls in merchant processing can create liabilities and losses. If a lower-fee option increases unresolved exceptions or fragile payout handling, the apparent savings can turn into operational drag.
Step 4 Rerun the decision before contract signature#
If an option only wins on visible fees, rerun the decision with full scope before you sign. Use one consistent horizon, one shared demand model, and documented tradeoffs across all options.
Finish with a verification checkpoint: confirm each option has an owner and supporting reference for rate assumptions, compliance and tax operations, internal labor, and risk notes. If any of those are missing, the decision is not ready for signature.
Validate the model before you present it#
Do not present the model until it can survive a hard challenge on scope, horizon, and real operating impact. The goal here is decision-grade Total Cost of Ownership (TCO) over a defined period, not a cleaner-looking spreadsheet.
Step 1 Stress-test scope, not just arithmetic#
Review the model and challenge the major assumptions. Confirm visible lines like Platform Subscription Fees and Payment Processing Rates are explicit, then check for hidden cost exposure such as maintenance effort or revenue impact from outages or slow performance.
Step 2 Force a like-for-like horizon#
Use one fixed window across all options, ideally a 3-5 year comparison horizon instead of a monthly snapshot. A lower upfront price can still create higher long-run cost, so keep scenarios comparable before you rank choices.
Step 3 Check the model before implementation starts#
Before implementation starts, run a careful validation pass. If assumptions no longer match current conditions, update them or mark them unresolved rather than letting them pass into final totals.
Step 4 Treat validation as ongoing, not one-time#
Once assumptions are validated, keep a baseline and revisit it over time. TCO should be used to measure value consistently, not only for a one-time estimate.
For a broader infrastructure view, see Global Payment Processing Infrastructure Choices for Platforms.
Conclusion#
The right decision is usually not the lowest visible fee. It is the option that protects long-term margin after full TCO is modeled and assumptions are verified. If you want a neutral refresher on lifecycle-cost framing outside payments, compare TechTarget's TCO definition with NetSuite's ERP TCO primer. Use this checklist to move from analysis to a decision:
- Define scope and lock the horizon.
Keep scope identical across options: authorization and capture, fee deduction, splits, tax handling, payouts, refunds, disputes, and reversals. Use one constant window across all options. A three-to-five-year horizon is a common range, and a 3-year view means converting monthly fees by multiplying by 36.
- Model fees from your real transaction mix.
Do not rely on one blended rate. Break fees by key drivers in your mix, for example rail, geography, currency, ticket size, refunds, and failures, so margin movement is visible. Rough benchmarks can start around 2-3.5% per transaction plus a fixed fee, and may land closer to 2-5% of GMV after payout and gateway costs, but those are not universal or contractual rates.
- Add non-fee costs that usually get missed.
TCO includes direct and indirect costs over time, not just purchase price. Include implementation, maintenance, QA, support, and the operational work required to keep integrations running and secure. For custom software, maintenance can become a meaningful annual cost relative to the initial build, so keep it explicit in the model.
- Compare architecture, not just vendor quotes.
Evaluate tradeoffs across payment rails, bank-transfer paths, and payout structures. Settlement-flow design affects working capital and reconciliation complexity, so it belongs in the cost model. A lower headline fee can still lose if it increases exceptions, manual reconciliation, or support load.
- Validate cross-functionally and freeze assumptions.
Finance should reconcile modeled totals to settlement data. Ops should validate failure, payout-exception, and support assumptions. Product and engineering should confirm customer-path impact and build and maintenance effort.
- Choose the option with better margin and acceptable risk.
After normalization, pick the path with stronger long-term unit economics. If totals are close, prefer the option with lower operational fragility and cleaner reconciliation.
If you want to model this with your actual payout flows and controls, map your requirements against implementation details here: Review Gruv docs.
Frequently Asked Questions
How do I calculate **Payment Processing Fees** inside a full **TCO** model?
Treat payment processing fees as one line in a full Total Cost of Ownership model, not the whole model. Build the fee view from your real transaction mix and place it beside setup, maintenance, support, staffing, compliance, tax, and downtime costs over the same horizon. Use final contract terms and historical processor data where possible.
Which hidden costs are most often missed when comparing payment platforms?
The most commonly missed costs are development and maintenance effort, IT staffing, support work, and revenue loss during outages or slow performance. Implementation, integration upkeep, ERP and reconciliation work, and manual recovery effort can also shift the economics. These costs often explain why a cheaper-looking option becomes more expensive later.
What time horizon should I use for platform **Total Cost of Ownership (TCO)**?
Use one consistent multi-year horizon for every option. A three to five year window is common in the guide. Model costs by year and include out-year increases when contract terms allow.
Is monthly platform pricing a reliable proxy for total payment cost?
No. Monthly platform pricing is only one visible cost line. A reliable model also includes ongoing and indirect costs such as maintenance, support, staffing, and other operational burden.
How do I compare two providers fairly when one has lower headline rates?
Use the same written scope, demand model, and time horizon for both providers before comparing totals. Include visible and hidden costs in one model and anchor major pricing assumptions to contracts, invoices, and processor data. A lower headline rate is not decisive if total multi-year cost is higher.
When does a higher-fee **Merchant of Record (MoR)** setup still make economic sense?
A higher-fee Merchant of Record setup can still make sense when the provider offloads enough operating, compliance, or tax work to lower total multi-year cost. Use the same TCO model and comparison window for that test. There is no universal break-even point in this guide, so evaluate it case by case.
Researched and edited by the Gruv editorial team. Gruv builds cross-border billing, payouts, and finance-operations software for global businesses.
Sources
- consultations.worldbank.org/content/dam/sites/consultations/doc/migratio...trusted
- gsa.gov/real-estate/rent-pricing-and-paymentstrusted
- josephmahoney.web.illinois.edu/BA545_Fall%202022/Cuypers%2C%20Hennart%2C%20...trusted
- occ.treas.gov/publications-and-resources/publications/comp...trusted
- oecd.org/content/dam/oecd/en/publications/reports/201...trusted
- publications.anl.gov/anlpubs/2021/05/167399.pdftrusted
- stripe.com/connect/pricingtrusted
- stripe.com/pricingtrusted
Educational content only. Not legal, tax, or financial advice.
Related Posts

The Freelance Payment Penalty: A Modeled Audit of Platform Fees, FX Spreads, and Payout Delays
The money rarely disappears through a single, easy-to-spot fee. The real loss is stacked. A marketplace takes its commission, a processor adds a charge for international cards, a bank or payment company converts the currency at a spread, a platform holds the funds before release, and a wire sheds a little to intermediaries on the way in. Each layer looks defensible on its own, but the worker feels the combined result as a smaller deposit and a later payday.

How to Respond to a Subpoena for Business Records
Move fast, but do not produce records on instinct. If you need to **respond to a subpoena for business records**, your immediate job is to control deadlines, preserve records, and make any later production defensible.

A US Expat's Guide to Investing in UCITS ETFs to Avoid PFIC Issues
The real problem is a two-system conflict. U.S. tax treatment can punish the wrong fund choice, while local product-access constraints can block the funds you want to buy in the first place. For **us expat ucits etfs**, the practical question is not "Which product is best?" It is "What can I access, report, and keep doing every year without guessing?" Use this four-part filter before any trade: