
Quick Answer
Start with payout operations data, not compensation benchmarks, then lock like-for-like cohorts and stable review windows before comparing performance. Use a compact KPI set tied to ledger, settlement, and close artifacts so changes are actionable. When you see signals such as a 3% weekly drop or reconciliation stretching to six days, treat provider views as supporting context and keep your internal record as decision truth. Include KYC, KYB, and AML gate effects in each cohort so speed gains do not hide control-driven delays.
Start With the Right Benchmarking Problem#
For this article, benchmark payout operations, not employee compensation. The focus is payment benchmarking and payout performance across your operating flow, not HR software, salary bands, or sales commission benchmarks. Compensation benchmarks answer what companies pay teams. Payout benchmarking answers where money movement breaks, slows, or needs manual repair.
| Comparison point | Payout operations benchmarking | Compensation benchmarking |
|---|---|---|
| What you measure | Payout execution and payment-operations performance | Employee pay levels, commissions, bonuses |
| Main data | Transaction events, provider outputs, ledger activity, reconciliation results, settlement outcomes | HR/payroll systems, compensation plans, salary surveys |
| Core question | Where are payouts failing or slowing? | Are pay packages competitive? |
| Typical signal | Reconciliation takes 6 days every month; a key payment metric drops 3% week over week | Pay compression, quota attainment, offer acceptance |
Benchmark the operating scope directly: ledger, reconciliation, settlements, and payout execution across rails and markets. Your setup should show where the payout stopped, what to fix first, and whether performance improved after the change.
When you compare providers or peers, account for platform model differences. Some orchestration setups are mostly connectivity and routing layers. Others bundle direct financial infrastructure with added services. Neither model is inherently better. The right comparison depends on your bottlenecks, goals, and operating setup. Start from the bottleneck you actually feel:
- A weekly deterioration signal, such as a sudden 3% drop in a key metric
- Back-office drag, such as matching taking 6 days every month
- Expansion friction, such as a 4-month integration path for a new market
Keep the trust boundary intact. If KYC, KYB, or AML gates are enabled for a cohort, include that in the benchmark. The goal is a benchmark you can trust to diagnose breakpoints, prioritize fixes, and show durable improvement under normal controls.
Once the problem is clear, decide where your benchmark data should come from.
Compare Benchmarking Approaches at a Glance#
Choose the benchmark source based on what you need to prove. If the result needs to hold up in operations and audit, use an internal baseline or a hybrid model as the record of truth. Treat external views as context.
| Approach | Data quality | Speed to insight | Implementation effort | Payout batches coverage | Webhooks reliability view | Posting traceability | Close effort | Main blind spot or tradeoff |
|---|---|---|---|---|---|---|---|---|
| Internal baseline | High when your event, posting, and settlements records are complete | Medium at first, then faster once instrumented | Medium to high | Usually strongest because it can include all real batches | Good when delivery, processing, and retry events are captured consistently | Strongest because payout-level evidence stays in your system | Higher upfront, lower ambiguity during close | Slower setup than provider reporting, but strongest for failure attribution and audit defense |
| Peer cohort | Medium because definitions and controls vary by operator | Medium | Medium | Often partial unless cohort scope is tightly matched | Often inconsistent across participants | Weak because payout-level traces are rarely shared | Medium to high due to normalization work | Useful for directional context, but scope mismatch can hide real differences |
| Provider SLA benchmark | Medium for provider-scoped events, lower for end-to-end payout flow | Fastest | Low | Limited to the provider segment | Often strong for provider timing, weaker for downstream handling | Weak outside provider scope | Low initially, then exceptions resurface during close | Fast benchmarking with weaker root-cause detail |
| Hybrid model | High when internal records remain source of truth and external views are mapped to them | Medium | High | Strong when internal coverage is complete and provider data is linked | Strong in practice because internal and provider timelines can be compared | Strong when request, provider reference, posting trail, and settlements are linked | Medium; heavier mapping, cleaner exception review | Best speed/diagnosis balance only if mapping discipline and definitions stay stable |
| Summary verdict | Use internal or hybrid as the record of truth | Accept slower setup when you need stronger evidence | Spend effort where attribution matters | Avoid methods that drop large batch segments | Treat webhook data as one layer, not proof by itself | If auditability matters most, preserve request-to-settlement evidence | Treat close friction as a core benchmark signal | Pick the method that still explains a failed payout after the dashboard view ends |
An internal baseline is the default for most teams because it reflects your actual operating mix and controls. If matching takes 6 days every month, this is the only method that can reliably tie that delay back to your own payout flow.
Peer cohorts are better for directional pressure testing than root-cause proof. They help you see whether performance looks unusual, but only when cohort scope and operating conditions are tightly aligned.
Provider benchmarking is useful when you need a quick first read, such as a sudden 3% week-over-week drop in a key metric. It can show provider-side drift quickly, but it usually cannot prove end-to-end performance outside that provider boundary.
Hybrid is the strongest option when you need both speed and a defensible diagnosis. Keep internal records as the source of truth. Then map provider context to that record so you can explain where a payout failed, what changed, and whether the fix held.
Before you compare any numbers, lock down scope so the benchmark stays comparable from one review to the next.
Set Scope Before You Compare Numbers#
Set the scope rules before you compare anything, or population changes can look like performance changes. Use payout cohort definitions as internal operating choices, and keep them stable long enough to make the comparison defensible.
A usable benchmark method is simple: agree how you collect, combine, and compare data, then apply that method consistently. Percentile views, such as 25th, 50th, and 75th, only help when the underlying cohort stays like-for-like.
| Scope decision | Minimum rule to set up front | If you skip it |
|---|---|---|
| Cohort design | Define explicit like-for-like groups before analysis | Blended results hide whether movement came from mix, not execution |
| Measurement window | Use a fixed comparison window | Week-over-week changes become hard to defend |
| Inclusion rules | Freeze what counts as in-scope before review | Teams debate denominator changes instead of investigating outcomes |
| Exclusions | Predefine anomaly handling and apply it consistently | One-off events can distort results and trigger rework |
| Documentation | Keep a benchmark log of rules and changes | Audit and close reviews become memory-driven |
If your operation already separates flows, such as MoR versus direct payouts, or VBA-linked versus card-funded, benchmark those flows separately rather than blending them. The same applies to any internal cohort dimensions you use, such as rail, corridor, recipient type, or risk tier. Define them once, name them clearly, and keep them steady.
Keep the process practical: freeze window and population rules, log any exclusions, and only compare outputs you can reproduce from your own operating records. Narrow, stable scope is what makes a benchmark useful.
With scope fixed, choose the metrics that actually help you make a decision.
Choose KPIs That Map to Operator Decisions#
Choose KPIs based on decisions, not dashboard volume. A useful KPI set gives each metric a clear owner, calculation source, and action trigger.
Use benchmarks to set targets, then judge performance by trend against those targets and comparable cohorts. A single reading is only a snapshot. Repeated movement in the same cohort should drive action.
| KPI | Working definition | Primary owner | Formula input and artifact to check | Action trigger | Do not optimize in isolation |
|---|---|---|---|---|---|
| Success rate | Share of payout attempts that reach final successful state | Payments ops | Attempt and outcome events from your event stream, provider states, and completion records | Falls versus target or recent cohort trend | Higher success can still mask delayed manual work or unresolved matching items |
| Time to payout | Elapsed time from accepted payout request to final completion | Payments ops + compliance ops | Request timestamp, status transitions, and final posting time | Slows while volume mix is stable | Faster release can increase returns, reversals, or control misses |
| Retry or failure rate | Share of attempts retried or ending unsuccessfully | Engineering + payments ops | Retry events, provider rejects, duplicate checks, and posting side effects | Sustained rise over recent periods | Aggressive retries can create duplicates and cleanup load |
| Return or reversal rate | Share of sent payouts that return or reverse | Finance ops + payments ops | Return codes, reversal events, and reversing entries | Upward movement that persists beyond one incident | Lower visible returns can come from delay, not quality improvement |
| Exception rate | Share of payouts routed to manual review or repair | Operations lead | Case queues, exception tags, status mismatches, and break reports | Backlog or aging rises even at flat volume | Suppressing exceptions can push problems into close or compliance |
| Close lag | Time from payout completion to matched, closed state | Finance ops | Entry records, settlement files, status records, and match timestamps | Aging items accumulate or close cycle stretches | Forcing matches can hide real breaks and weaken audit quality |
| Cost per successful payout | Total payout processing cost divided by successful payouts | Finance + payments ops | Fee records, provider charges, handling costs, and successful payout count | Cost moves against trend with stable mix | Cheapest path can raise failures, delays, or reversals |
Read the KPI stack as a comparison, not a scoreboard#
Read these KPIs together. Success rate should be read with retry or failure rate, time to payout with exception rate, and close lag with cost per successful payout. If one metric improves while another deteriorates, treat that as a tradeoff to investigate, not a win to report.
| KPI pairing | Read it as |
|---|---|
| Success rate + retry or failure rate | A tradeoff to investigate, not a win to report |
| Time to payout + exception rate | A tradeoff to investigate, not a win to report |
| Close lag + cost per successful payout | A tradeoff to investigate, not a win to report |
Use simple triage rules before escalation#
Start with consistent first checks. If failure rate rises while intake quality and approval patterns are stable, inspect rail or provider behavior first, including status changes, reject reasons, and retry shifts.
| Observed pattern | First checks |
|---|---|
| Failure rate rises while intake quality and approval patterns are stable | Inspect rail or provider behavior first, including status changes, reject reasons, and retry shifts |
| Time to payout worsens while provider status appears stable | Inspect KYC, KYB, or AML queue latency and manual-review aging as early checks |
| Success rate is steady but close lag rises | Review journal entries, settlement references, and unmatched-item aging before calling the change an improvement |
Use those checks as triage, not proof of root cause.
Set review cadence by metric type#
Set cadence by metric type, then keep it consistent. Operational KPIs are often reviewed weekly, while financial KPIs are often reviewed monthly. The exact schedule can vary, but consistency is what makes comparisons credible.
When KPI movement matters, you need an evidence pack that lets your team prove what actually happened. Related: Churn Rate Benchmarks by Industry: What Payment Platforms Should Expect and Target. If you want KPI triggers tied to concrete event and status objects, use this implementation checklist in Gruv docs.
Build the Evidence Pack Your Team Can Audit#
Your evidence pack should let your team explain outcomes quickly and defend them under audit. Treat evidence in three classes: payout records, close-cycle packets, and conditional tax or compliance attachments.
| Evidence class | When it should exist | What to include | Verification checkpoint | Common failure |
|---|---|---|---|---|
| Payout-level operational record | Every payout in your program | Request ID, idempotency key, provider reference, Webhooks timeline, posting records, final settlement state | One file can trace the payout from request to final settlement and posting state | Results look fine, but root cause cannot be proven |
| Close-cycle exception packet | Every close cycle | Payout-level exceptions, unmatched items, aging buckets, remediation owner | Open items, age, and owner are explicit before close | Breaks are pushed into aging instead of resolved |
| FEIE attachment set | Only when FEIE is claimed | Tax return reporting the income, plus Form 2555 or Form 2555-EZ; day-count support if using physical presence test | For physical presence: 330 full days in 12 consecutive months; count only full 24-hour days from midnight to midnight | Day count misses the threshold, so the test fails unless an adverse-conditions waiver applies |
| Other tax/compliance attachments | Only when your policy or applicable law requires them | W-8, W-9, Form 1099, FBAR, VAT validation artifacts per your policy | Policy names trigger, owner, source system, and retention rule | Teams assume universal requirements and cannot explain missing documents |
Make payout records and close-cycle packets non-optional in your control design, then apply tax attachments by rule. For FEIE specifically, treat it as a documented claim. It applies only to a qualifying individual with foreign earned income, the income is still reported on a U.S. tax return, and the claim artifact is Form 2555 or Form 2555-EZ.
For W-8, W-9, Form 1099, FBAR, and VAT validation, define those requirements explicitly in your policy so attachment decisions stay consistent and auditable.
Once your evidence is solid, compare performance by the payout path where the work and failure modes actually sit. Related reading: Microsoft Dynamics 365 for Payment Platforms: Finance Module Setup and Payout Integration Guide.
Benchmark by Payout Path Instead of Global Averages#
Do not rely on one blended platform average as your primary benchmark. Compare MoR, direct payouts, and VBA-linked flows as separate paths so you can see where timing, exceptions, and close effort actually differ.
A single platform-wide success or payout-speed number can hide operational concentration. If you cannot explain results by path, corridor, and program from your own records, the benchmark is too blended to drive decisions.
| Payout path cohort | Compare separately | Verification checkpoint | Risk if blended |
|---|---|---|---|
| MoR | Timing, exception handling, close workload | Trace sample payouts from request ID through provider reference, webhook timeline, posting trail, and settlement state | A stable headline metric masks path-specific operational drag |
| Direct payouts | Timing, retry/failure handling, close-cycle cleanup load | Confirm each payout ties cleanly to its close packet and owner | Issues look random when they are operating-model specific |
| VBA-linked flows | Timing, matching behavior, manual intervention load | Verify the inflow-to-payout link is visible in payout and settlement evidence | Normalized averages hide matching friction in one funding flow |
Speed is not enough#
Treat speed and exception load as separate views. A path can look fast on clean items while creating heavier exception work for the team. If AML holds are frequent in a segment, read timing and hold-driven exception handling together before calling that path better.
Segment where risk or volume changes the story#
Use segment-level views where behavior changes materially, such as higher-risk corridors, higher-volume lanes, or program variants with different control intensity. Keep inclusion rules fixed and segment labels explicit so comparisons stay auditable.
Add a coverage note every time#
For every path comparison, include a plain note that coverage varies by market and program. State what is in scope for that slice, including markets, rails, and program types, and list known exclusions so readers do not overgeneralize.
Benchmark paths separately first, then compare segments within each path. If you publish one executive roll-up, keep it secondary to the path-level view that shows where operations need attention.
To make those path-level comparisons useful week after week, classify failures the same way every time.
Classify Failures the Same Way Every Week#
Use one fixed failure vocabulary each week, and classify from normalized transaction evidence instead of PSP-specific dashboards. If labels shift week to week, your trendline reflects naming changes, not real payout performance.
This is a practical risk, not a theoretical one. Provider reporting can differ by field, time window, and label, and teams can classify the same event differently. That is why your weekly review should start from one harmonized view built from transaction-level data across PSPs, acquirers, and gateways.
Use one normalized class as the weekly source of truth#
| Classification basis | Cross-provider comparability | Weekly trend reliability | Root-cause usefulness | Main failure mode |
|---|---|---|---|---|
| Raw PSP reason codes | Low | Low | Medium inside one provider | Similar events are labeled differently by provider |
| Normalized internal failure classes | High | High | Medium to high when evidence rules are clear | Requires discipline to keep definitions fixed |
| Close exception labels only | Medium | Medium | Low for execution issues | Close-cycle labels can hide where the payout first broke |
Use normalized internal classes as the primary weekly metric, and keep provider reason codes and close labels as supporting context.
Keep the taxonomy small and reproducible#
Start with a small internal taxonomy your team can apply the same way every week. You can include classes such as data-quality issues, compliance-related holds, provider rejects, retry or timeout patterns, settlement mismatches, and close-only breaks. Treat these as internal operating labels, not universal standards.
Your checkpoint is reproducibility: a second operator should reach the same class from the same evidence packet. Use a consistent packet format with the consolidated transaction record, provider response, webhook timeline where relevant, settlement state, and related posting records.
Define routing and retry boundaries up front#
Write routing ownership beside each class before incidents occur, so failures do not bounce between teams. Keep these rules explicit and local to your operating model.
For retries, define when an item is still a transient retry, when it becomes a retry-loop or timeout case, and when it moves to manual review. Then validate idempotent behavior in sample posting records so replayed items do not create duplicate movements.
The practical standard is simple: fixed taxonomy, evidence-based classification, and clear retry boundaries. That keeps weekly failure benchmarking credible and comparable.
With classification fixed, you need a review rhythm that keeps issues moving instead of aging in place.
Run a Weekly Operating Cadence With Named Owners#
Run payout operations on a fixed weekly cadence with explicit owners, because that is the fastest way to keep diagnosis and remediation moving. Keep operational review weekly, and keep profitability review monthly. If your traffic mix shifts often, reset your internal baseline assumptions on a monthly rhythm so comparisons stay useful.
| Operating model | Decision speed | Root-cause quality | Benchmark credibility | Common failure mode |
|---|---|---|---|---|
| Named-owner weekly cadence | High | High when each issue is tied to evidence | High | Requires strict time blocks and explicit follow-up |
| Shared multi-team review with no clear owner | Medium to low | Medium | Low | Issues bounce between teams and get relabeled instead of fixed |
| Dashboard-only monitoring with ad hoc escalation | Fast to notice, slow to resolve | Low | Low | Reporting shows symptoms but not where the payout broke |
Keep the weekly sequence fixed: KPI readout, exception review, root-cause assignment, remediation commit, then checkpoint follow-up. Time-block the review. When it slips, exceptions age and the benchmark turns into stale reporting. For each escalated issue, keep evidence attached so the owner can verify what happened and where.
A practical ownership split#
Ownership mapping is local to your org, but each issue still needs one primary owner. In many teams, finance ops leads close exceptions, payments ops leads routing and settlement breakpoints, and product or engineering leads webhook reliability and idempotency defects. For cross-functional issues, name one driver and one supporting owner instead of shared ownership by committee.
| Issue area | Typical owner | Context |
|---|---|---|
| Close exceptions | Finance ops | In many teams |
| Routing and settlement breakpoints | Payments ops | In many teams |
| Webhook reliability and idempotency defects | Product or engineering | In many teams |
Use the next cycle as the quality gate#
Treat the next weekly cycle as your closure check. Do not close an issue on shipment alone. Close it when the next review shows the exception is actually gone and no new mismatch replaced it. This keeps your benchmark tied to outcomes, not activity.
That discipline matters because most benchmarking mistakes do not look obvious at first. They look like clean numbers. For a step-by-step walkthrough, see ERP Integration for Payment Platforms: How to Connect NetSuite, SAP, and Microsoft Dynamics 365 to Your Payout System.
Avoid Benchmarking Mistakes That Create False Confidence#
False confidence usually comes from three errors: using the wrong benchmark domain, comparing non-equivalent cohorts, or declaring success before ongoing checks confirm it.
| Mistake | Why it creates false confidence | Better move |
|---|---|---|
| Using generic "benchmarking" guidance as payout evidence | Much public guidance is about executive compensation benchmarking, which is a different decision context than payout operations | Use payout-operations evidence for payout decisions; treat compensation content as non-transferable unless separately validated |
| Comparing mixed cohorts without normalization | Irrelevant comparisons can mislead decisions, and unadjusted context differences distort results | Normalize cohorts for meaningful context differences before interpreting performance gaps |
| Treating a single result as proof | Benchmarking is not one-and-done; outcomes need post-implementation monitoring | Keep monitoring after changes and confirm performance holds over time |
| Weak peer-group selection | Peer-group fit is foundational to accurate benchmarking | Define the comparison group first, then evaluate outcomes against that baseline |
A practical rule is simple: if the comparison set is not equivalent, or the source intent is not payout operations, do not treat the result as decision-grade evidence yet.
From there, your next move should match the operating situation you are actually in.
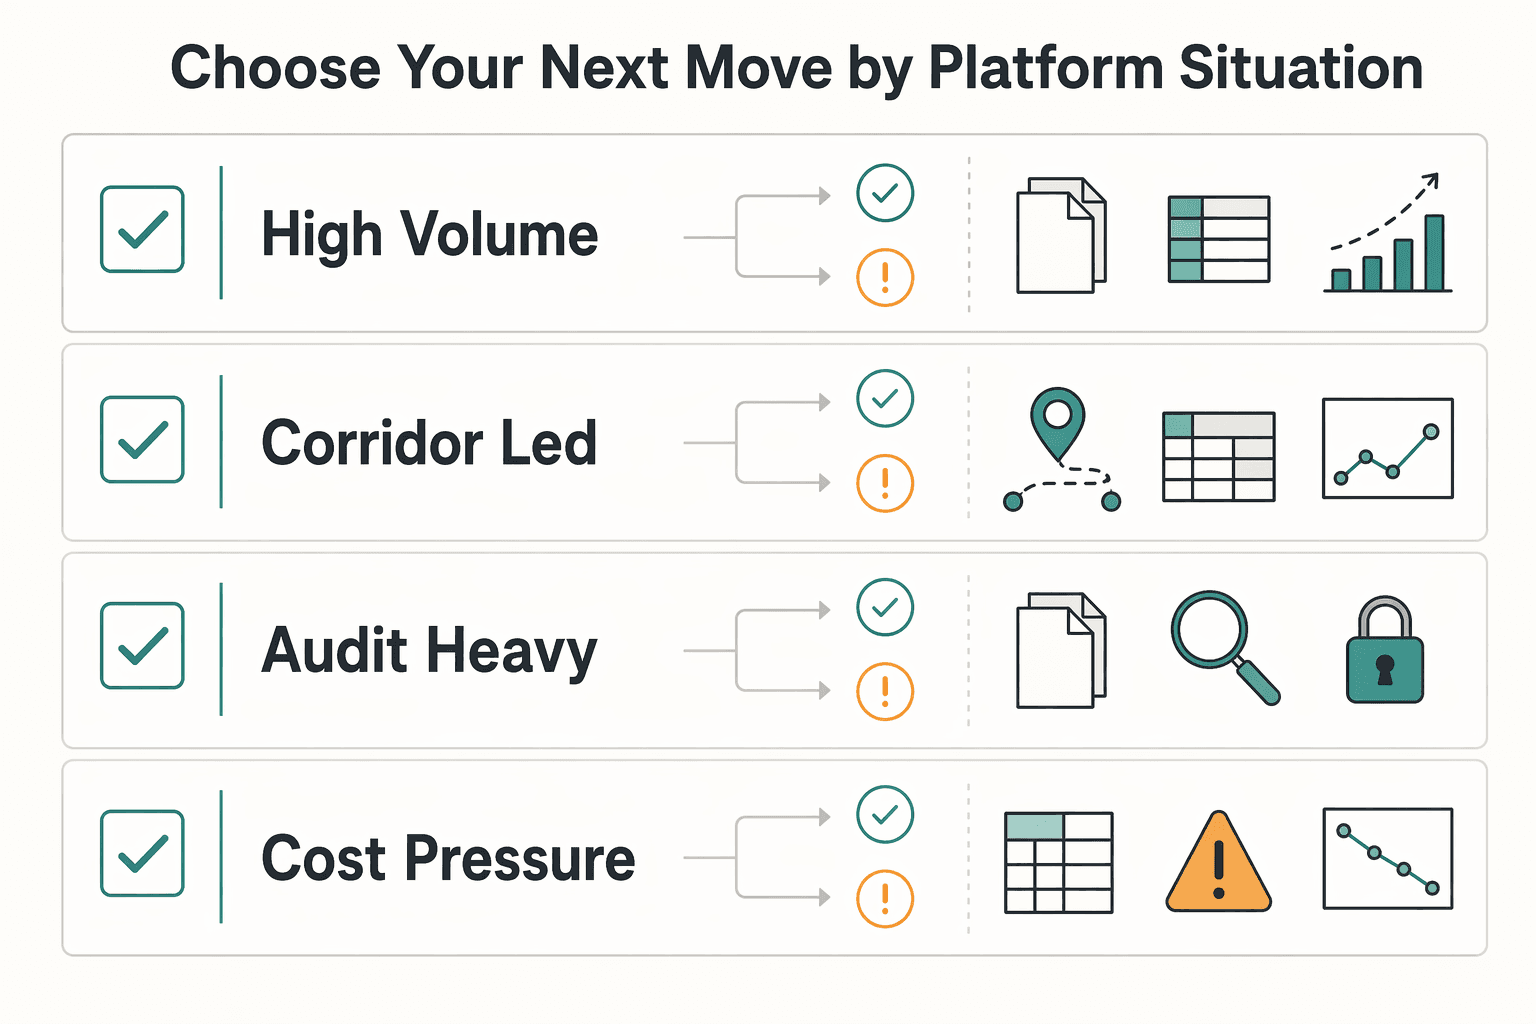
Choose Your Next Move by Platform Situation#
Choose the next move based on the uncertainty your team can explain end to end, not just the metric that updates fastest. When you face a speed-versus-clarity tradeoff, favor the view you can trace and defend.
| Platform situation | What to compare first | Verification checkpoint | Red flag |
|---|---|---|---|
| High-volume Payout batches | One fixed batch slice over time, with like-for-like exception outcomes | A second reviewer can reproduce the same result from the same inputs without manual rebuilds | Teams are still piecing answers together from spreadsheets |
| Corridor-led growth | Like-for-like segment cuts instead of one platform-wide average | Inclusion rules stay fixed, and the same cut can be rerun on schedule | The dashboard is fast, but a corridor spike cannot be clearly explained |
| Audit-heavy period | Comparisons tied to a complete, review-ready evidence path | One payout outcome can be reviewed in one path without export hopping | Proving one outcome requires multiple disconnected exports |
| Cost pressure with stable reliability | Cost per successful outcome in the same cohort before and after a change | The cohort definition is unchanged between both reads | Lower apparent cost comes with more manual handling |
Use this practical rule: fix the biggest manual explanation gap before widening scope. Benchmarks that are responsive but hard to explain are weak decision support, and complex manual workflows are a known loss risk.
Frequently Asked Questions
What is payout benchmarking for platforms?
Payout benchmarking is an operations exercise: compare payout outcomes, controls, and traceability across like-for-like cohorts. It is different from salary benchmarking, which focuses on market pay for jobs and compensation structures. If you cannot trace a payout through controls to a final outcome, your benchmark is not operationally reliable.
Which KPIs matter most for payout performance?
Use a small KPI stack that covers outcome quality, payout timing, failure and retry behavior, close lag, and cost per successful outcome. Act when a metric moves against its own baseline or conflicts with adjacent signals, rather than reading one metric in isolation. For example, a sudden success-rate drop or matching stretching into a multi-day close window should trigger investigation even if another metric still looks acceptable.
How do we compare to industry when public data is thin?
Use three views together: your internal baseline, peer-style cohorting, and provider evidence. The baseline shows whether you improved, cohorting prevents unlike-for-unlike comparisons, and provider comparisons are directional inputs rather than neutral truth. Keep cohort inclusion rules fixed so the same cut can be rerun and defended.
What usually causes payout failures first?
Start triage with four buckets: data quality issues, compliance holds, provider rejects, and orchestration gaps. This keeps incident review focused on the first control point that broke instead of jumping straight to a full-flow rebuild. Use the same buckets every week so failure trends stay comparable. When you are ready to operationalize benchmark actions across routing, policy gates, and batch execution, review Gruv Payouts.
Try a related tool
Researched and edited by the Gruv editorial team. Gruv builds cross-border billing, payouts, and finance-operations software for global businesses.
Sources
- austintexas.gov/ne-np/page/austin-bicycle-plantrusted
- documents.dps.ny.gov/public/Common/ViewDoc.aspxtrusted
- irs.gov/individuals/international-taxpayers/foreign-...trusted
- irs.gov/individuals/international-taxpayers/figuring...trusted
- occ.gov/publications-and-resources/publications/comp...trusted
- oecd.org/content/dam/oecd/en/publications/reports/201...trusted
- pmc.ncbi.nlm.nih.gov/articles/PMC5161317trusted
- pmc.ncbi.nlm.nih.gov/articles/PMC6611555trusted
Educational content only. Not legal, tax, or financial advice.
Related Posts

How PROs Collect Performance Royalties and How Platforms Distribute Payouts
Treat this as an infrastructure decision, not a music-rights explainer. If you cannot connect PRO collection to a payout process you can verify, reconcile, and audit, you are not ready to ship a royalties product, no matter how strong the demand story looks.

Churn Rate Benchmarks by Industry for Payment Platforms
If you run a payment platform, start with this assumption: there is no single churn benchmark you can safely copy from search results. Published benchmarks come from different market cuts, including broad industry datasets, B2B SaaS reports, subscription-app reports, and payment-method segments. These are not directly comparable without normalization.

Payment Decline Rate Benchmarks for Platform Operations
A useful decline-rate benchmark is not a headline percentage. It is a repeatable view of your own traffic that clearly defines the cohort, the processor path, and what happened after authorization through settlement and payout reconciliation.