
Quick Answer
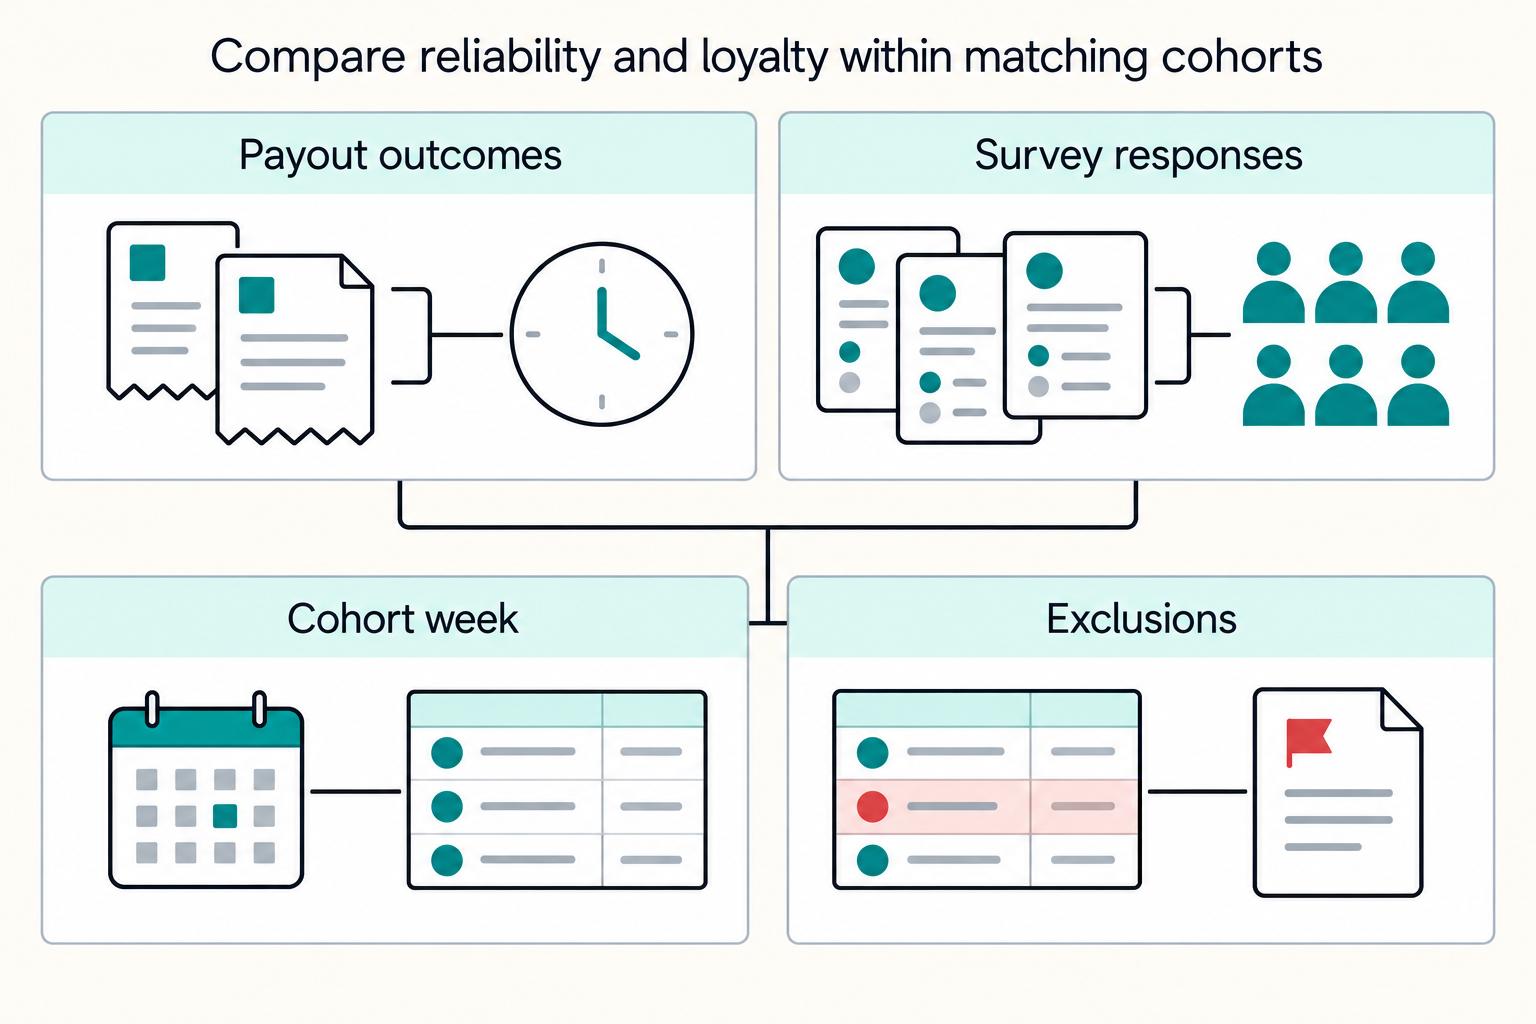
Track distinct payout intents due in a fixed window, confirmed on-time outcomes, late and overdue-pending items, failures, returns and holds. Keep provider status separate from recipient receipt evidence. Calculate Net Promoter Score as 100 times promoters minus detractors divided by all valid responses, including passives in the denominator. Report invitation counts, response rates and survey method; include unsuccessful recipients in sampling. Aggregate payout and survey records separately before joining by cohort and exposure window. Publish the full recipient-facing view beside any execution-only exclusions. Use complaints and behavioral evidence to investigate shared changes, respond to concrete incidents immediately, and scope rollout pauses to the affected decision.
Why payout reliability matters for contractor loyalty#
Step 1 Treat payout reliability as a testable loyalty hypothesis#
When a payout arrives late, a contractor may lose confidence in the platform even if the transfer eventually succeeds. Measure that risk with the actual payout record and feedback from the affected people. Co-movement between payment problems and Net Promoter Score (NPS) is a reason to investigate; it does not establish that payouts caused the score change.
Start with two questions: did contractors receive funds within the promise you made, and did the affected cohort report a worse experience? Keep payment quality, recommendation intent and subsequent behavior separate so one noisy score does not become a substitute for investigating late money.
Step 2 Frame the issue as a monetization choice under constraints#
This is a monetization decision under operating constraints, not a generic CX debate. Changes that improve margin on paper, such as payout path, timing, or exception handling, can also change how contractors experience getting paid.
Keep product, finance ops, and leadership focused on the same decision. Otherwise, a change can look efficient in a spreadsheet while quietly weakening trust where supply is hardest to replace. If a payout change touches timing, completion certainty, or status clarity, measure the loyalty effect instead of assuming it is noise or assuming every dip is pricing.
Step 3 Respect the evidence limits before you act#
NPS measures stated recommendation intent on a 0–10 scale. The Net Promoter definition classifies 9–10 as promoters, 7–8 as passives and 0–6 as detractors. Compute NPS as 100 × (promoters − detractors) / all valid responses; passives stay in the denominator. Scores range from −100 to +100 and are points, not an average 0–10 rating.
For example, 100 valid responses with 60 promoters, 20 passives and 20 detractors produce NPS +40. If you invited 250 eligible contractors, the response rate is 40%. Report both numbers. Ten responses with six promoters and two detractors also give +40, but one response changes that small sample substantially. Do not present identical scores as equally precise or treat nonresponse as proof of satisfaction.
That is the through line for everything that follows: get the measurement design right, define quality in operational terms, and only then decide whether margin changes are worth the trust risk.
What to prepare before you start#
Use a defined exposure window for payouts and a documented survey schedule. A quarterly relationship survey and a payout-triggered survey need not share the same response date. Link feedback to the contractor and the payout period it can reasonably describe, and preserve invite date, response date and the lookback window.
Step 1 Lock the baseline and sampling rules#
Define who is eligible, how invitations are selected and how often one contractor can respond. For relationship NPS, use a consistent contractor sampling rule. For payout feedback, invite around a defined experience or promised deadline and include failed, pending and held cases—not only successful transfers. Record question wording, language, channel, invitation count, valid responses and duplicate handling.
Keep one valid relationship response per contractor per measurement wave under your documented rule. A transaction survey can have more than one response per contractor, but then labels and analysis must make the transaction weighting explicit. Do not let a contractor with many payouts silently count as many relationship respondents.
Step 2 Confirm what counts as the money record#
Use a unique business payout intent as the counting unit and retain every execution attempt under it. Provider status is one source of evidence, not the entire recipient experience. Define what “completed” means for the rail and what confirms receipt; a platform ledger debit or a sent status alone is not proof of usable funds in the contractor’s account.
Retain promised arrival deadline, initiation time, provider references, status history, observed receipt evidence, returns and the accounting trail. Keep provider-estimated arrival separate from your original promise. Stripe’s payout object, for example, notes that a payout can initially show paid and later fail. Report the observation cutoff and return window rather than calling every early paid status final.
Step 3 Write down policy constraints before scoring reliability#
List policy gates that may affect payout timing or completion, including KYC, KYB, and AML checks where enabled. Add clear flags so later analysis can separate policy-driven delays from payout-operations issues.
Step 4 Assign owners and collect the evidence pack#
Set ownership up front. Product owns event instrumentation, finance ops owns reconciliation, and ops owns exception logs. Require written evidence from each owner so your analysis starts from documented inputs, not verbal summaries.
Define payout quality in terms your teams can operate#
Reliability asks whether an obligation is met within its promised window without an unresolved failure. Quality also includes accurate status, usable explanations and recovery. A required hold can be correctly enforced while still making the contractor’s experience poor; keep the cause and experienced delay visible.
Step 1 Use a narrow working definition first#
Write one sentence for each term and tie both to the same observation window from the previous section. Use this split in operating reviews:
- Reliability: completion against a recorded promise, with pending, late, failed and returned outcomes visible.
- Quality: status accuracy, recipient effort, hold communication and recovery, alongside completion.
Keep the distinction explicit, because quarter-level feedback can look stable even when operational problems are building underneath it.
Step 2 Build a scorecard teams can verify from records#
Your scorecard should use dimensions that product, finance ops, and support can trace end to end. If the team still lacks a shared frame, start with a payment operations maturity model and a payout error-rate dashboard so reliability debates start from the same operating evidence.
| Dimension | Calculation or evidence | Reporting boundary |
|---|---|---|
| On-time payout rate | Distinct due payout intents confirmed within the original deadline / all included intents due in the window | Count late, failed and overdue-pending intents in the denominator; report not-yet-due items separately |
| Return/failure rate | Distinct failed or returned intents / observed intents in the declared population | State cutoff and observation lag; restate provisional results for later returns |
| Retry recovery | Distinct failed intents successfully recovered / distinct failed intents eligible for the defined recovery path | Count one intent, not each attempt; distinguish recovered late from recovered on time |
| Case resolution | Opened/resolved times plus current age of still-open cases | Report unresolved backlog and age beside closed-case durations; closing easy cases must not hide stranded work |
Checkpoint: sample each dimension and confirm you can trace the payout event, status updates, and posted record without gaps.
Step 3 Map each dimension to NPS risk hypotheses#
Use this as a risk map, not proof of causality.
Test three questions: do people with repeated lateness report more payout-related complaints; does clear recovery reduce repeat contacts; and do unresolved cases predict weaker return-to-work behavior where work opportunities exist? These are hypotheses to check against your data, not guaranteed characteristics of promoter, passive or detractor groups.
Review short incident periods alongside longer relationship trends. Preserve a before/after baseline and note simultaneous changes to work availability, fees, support or contract terms. A general customer-service case from another industry is not evidence of a contractor-payout causal effect.
Step 4 Set one red-line rule before review#
If confirmed payout performance worsens while NPS stays flat, investigate the payment incident anyway. A flat score may reflect survey timing, sparse responses or unaffected respondents; it is not assurance that contractors had no problem.
In that case, watch retention and switching signals alongside the scorecard, and use fast feedback loops for immediate service recovery instead of waiting for the next quarter close.
Split NPS correctly so you do not misread loyalty#
Use separate, clearly labeled survey streams, and treat score differences as prompts to investigate, not conclusions about loyalty.
| Survey stream | Tied to | Use in review |
|---|---|---|
| Experience NPS | Specific experiences or transactions | Compare it with the payout quality scorecard before deciding what changed |
| Relationship NPS | Your regular relationship sample | Use it with Experience NPS to judge whether the issue is isolated to the payout touchpoint or broader |
| Competitive benchmark NPS | A separate benchmark field if your team tracks it | Use comparable question, population and method; retain each benchmark vintage rather than overwriting prior context |
Step 1. Label the survey and question. Keep transaction-triggered recommendation feedback separate from relationship NPS. A payout satisfaction or effort question is useful, but should not be relabeled NPS merely because it uses a numeric scale. Bain’s reliable-metric guidance discusses method consistency, response bias and the distinction between an interaction and the overall relationship. Record your method rather than assuming these streams are interchangeable.
Verification point: confirm each score has a survey label, owner, collection date, and intended use in the raw export.
Step 2. Treat split-score movement as a test queue, not proof. If one stream drops while another looks steadier, do not assume loyalty is fine and do not assume a single root cause. Check the same cohort and time window against your payout quality scorecard, on-time completion, reversals or returns, retry success, and case-resolution time, before deciding what changed.
Step 3. Do not let a blended average drive the diagnosis. Single quarter averages can hide short incidents. Keep the streams separate in review so incident checks stay tied to the right survey context and timeframe.
Instrument payout events end to end before you analyze impact#
Reconcile the payout data before estimating a loyalty effect. Continue incident response even when analysis is incomplete: missing evidence is a reason to qualify conclusions, not to delay helping contractors with overdue money.
| Control | What to verify | Why it matters |
|---|---|---|
| Transaction timeline | One queryable record from request through final accounting outcome, including status history and posted ledger journals | If teams cannot produce the same timeline for the same payout, pause impact analysis |
| Retries and webhook ingestion | Stable idempotency handling for payout creation and webhook ingestion, with logic that distinguishes a replayed event from a genuinely new payout action | Prevents duplicate retries from being counted as new business outcomes |
| Incident taxonomy | One shared, enforced taxonomy with one primary category per exception plus free-text context | Keeps failure patterns comparable over time |
| Daily reconciliation | Business intent and attempts match provider movements, accounting effects and available recipient evidence | Resolve differences and flag uncertainty; a ledger posting alone does not prove recipient receipt |
Step 1: Define one intent with its attempt history. Retain contractor ID, original promised deadline, currency/amount, provider transfer IDs and timestamps. A reissued or retried payout must link to the original obligation so success rates cannot improve by counting retries as new, easier payments.
Step 2: Make retries replay-safe. Use stable idempotency handling for payout creation and webhook ingestion so duplicate retries are not counted as new business outcomes. Verify that your logic can distinguish a replayed event from a genuinely new payout action.
Step 3: Standardize incident labeling across teams. Use one shared, enforced taxonomy for exceptions so failure patterns stay comparable over time. Keep one primary category per exception, then add free-text context instead of ad hoc labels.
Step 4: Reconcile the financial result. Compare provider movements and references with journal effects, returns and any receipt evidence. Label unresolved or inferred outcomes. Data discrepancies limit claims about causality, while a confirmed late obligation can still require immediate recovery and communication.
Build the weekly reliability-to-loyalty dataset#
Once the records are trustworthy, review reliability, survey movement, and retention proxies in the same frame. Use one cohort-week table as your operating source. Treat it as an internal decision tool, not proof of causality or an external standard.
Step 1 Build one cohort-week table and lock the grain#
Store payout intents and survey responses at their own grains. Aggregate each to the cohort/week before joining the aggregates; joining raw payouts to raw responses by contractor can multiply both counts. Keep payout due-week, survey exposure-week and response-week as separate fields. Relationship responses belong to a survey wave; do not copy one response into every payout week as independent evidence.
A cohort-week row should contain due intents, confirmed on-time intents, overdue pending, late completion, failures/returns, holds and data-quality flags; survey invitations, valid responses and promoter/passive/detractor counts; and the cohort/method versions. Derive rates from those counts. For an aggregate NPS, sum compatible response counts and recompute the score instead of averaging weekly NPS values with different sample sizes.
Step 2 Add diagnostic segmentation columns, but keep them controlled#
Use region, rail, payout program and tenure where they answer an operational question. If an external MoR or partner handles a stage, label that responsibility rather than assuming “MoR” is itself a payout rail. Keep both incident exposure and cohort membership so you can compare impacted and unimpacted contractors within a relevant segment.
Control allowed values, keep an explicit unknown bucket, and avoid silent remaps across systems. If segments get too sparse, roll them up for trend review and keep the detailed cuts for investigation.
Step 3 Flag exclusions instead of deleting rows#
Keep every due obligation in the recipient-facing view, including policy holds. A secondary execution-only view may exclude documented pre-execution holds under a fixed rule, but publish excluded counts, reasons and the full view alongside it. Do not move the original deadline after an incident or remove late cases merely because their cause was compliance.
For an illustrative week, 200 payout intents are due. At cutoff, 180 are confirmed on time, eight completed late, seven remain overdue pending and five are failed. The full on-time rate is 180/200 = 90%. If ten of the 20 not-on-time intents were documented pre-execution holds, an execution-only slice is 180/190 = 94.7%, with ten excluded and the full 90% still shown. The higher filtered rate does not erase ten missed recipient expectations.
Step 4 Run a fixed review cadence#
Review exceptions weekly and sufficiently populated trends monthly. Publish sample counts and response rates beside NPS, roll sparse cells into a predeclared longer window, and keep detailed cases available for recovery. Refresh any competitive benchmark when comparable new data is available; retain its collection date and method.
Set decision rules for when to change roadmap or pricing#
Once the cohort-week table is stable, set the override rules before the next pricing or roadmap debate. Decide in advance what evidence is strong enough to change course, not argue it after the fact.
| Scenario | Action | Checks or record needed |
|---|---|---|
| Confirmed reliability defect and worsening payout feedback in the same cohort | Contain the defect and consider pausing the affected rollout or pricing change | Check exposed respondents, counts/method, complaint themes and the decision scope; do not halt unrelated work automatically |
| Reliability recovers but feedback stays weak | Check residual payment harm and recovery quality, then broader drivers | A completed late payout can still leave fees, uncertainty or unresolved complaints |
| A small portfolio move affects a strategic cohort | Escalate at the segment level, not only on global averages | Verify sample adequacy, check for one-off distortion, and confirm the cohort matters to your long-term strategy |
| A margin proposal adds payout friction for a high-value cohort | Require leadership sign-off with the tradeoff documented in writing | Include the affected cohort, expected margin upside, expected experience risk, rollback condition, and review date |
Step 1 Pre-commit the reliability override#
Write a scoped rule before rollout. For example, pause expansion of a new payout route when verified on-time performance breaches the route’s agreed tolerance and complaints point to that route. If a sufficiently supported feedback trend worsens too, escalate the affected commercial change. Define the baseline, tolerance, evaluation window, owner and rollback capability; no universal NPS cutoff fits every platform.
For illustration, a team might investigate an on-time-rate decline of at least three percentage points across two due-week windows and pause route expansion if records and complaints confirm the defect. That is an internal policy example, not an industry standard. Act immediately on missing funds or duplicate payment regardless of NPS response counts; sparse survey data limits trend claims, not incident response.
Step 2 Separate payment issues from broader loyalty issues#
If recorded reliability recovers but feedback remains weak, check payment-related harm first: lateness may have caused expenses, unclear status or repeated support contacts. Then investigate fees, work availability and other relationship drivers. Comparing exposed with similar unexposed contractors can sharpen diagnosis, but the groups may still differ; do not label an observational comparison causal.
Keep a one-page decision pack:
Include due-intent and outcome counts, survey invitations and response counts, sampling changes, complaint themes, affected contractors and the proposed action. Track actual behavioral outcomes too: repeat work, offer acceptance and departure. Measure repeat-work retention among contractors who had a relevant opportunity; lack of an offer is not necessarily voluntary churn.
If the proposal has only modeled margin benefit, define the missing experience evidence and a bounded test before scaling. A complaints-free survey sample alone cannot establish that no one was harmed.
Step 3 Escalate by segment importance, not portfolio averages#
Set escalation at the segment level, not only on global averages. A small portfolio move can still justify action when it affects a strategic cohort.
When a segment is flagged, verify sample adequacy, check for one-off distortion, and confirm the cohort matters to your long-term strategy.
Step 4 Require sign-off when margin gains add friction#
If a margin proposal adds payout friction for a high-value cohort, require leadership sign-off with the tradeoff documented in writing. The decision record should include the affected cohort, expected margin upside, expected experience risk, rollback condition, and review date.
This is the same discipline used in other retention-sensitive decisions: balance business stability and incentives explicitly when margin and trust are in tension.
Compare monetization options before cutting payout quality#
Before you change the payout experience, compare monetization levers side by side. In supply-constrained categories, protect reliability first. Where payout quality, Experience NPS, and exception handling are already stable, test other margin levers first. If the proposed change mainly affects timing, quantify the visible contractor impact with a contractor payout speed calculator before you book the margin upside.
Step 1 Put every option on one decision sheet#
Keep fee increase, rail downgrade, payout timing change, and support-tier reduction in one table with the same fields so the tradeoffs are visible.
For each option, document:
- affected cohort and market
- payout path (
Merchant of Record (MoR)or direct) - current baseline for payout quality,
Experience NPS, and exception volume - expected unit-economics upside and which cost line changes
- trust risk to monitor, including possible movement from
PromoterstoPassives - architecture constraints, including
Virtual Accountsand market coverage limits - rollback condition, review date, and named decision owner
Step 2 Compare economics and trust risk together#
Use the table to make a decision, not to predict an exact NPS move.
| Option | Unit-economics hypothesis | Payout-quality exposure | NPS signal to watch | Architecture checks |
|---|---|---|---|---|
| Fee increase | Margin can improve if pricing changes hold | Lower when payout flow is unchanged | Softening from Promoters to Passives if value perception drops | Pricing control, policy constraints, MoR responsibilities |
| Rail downgrade | Savings depend on usable lower-cost routes | Higher if completion, speed, or status clarity worsen | Early pressure in Experience NPS | Route support, reconciliation impact, Virtual Accounts fit |
| Payout timing change | May change operating costs; any claimed float benefit depends on legal fund ownership and permitted use | Higher because timing is directly felt | Fast sentiment change in payout touchpoint feedback | Cutoff behavior, messaging readiness, market constraints |
| Support-tier reduction | Service cost can decline | Risk appears during exceptions and recovery | Delayed NPS decline if cases age unresolved | Case ownership, status visibility, MoR support boundaries |
Step 3 Verify evidence quality before approval#
Treat modeled savings as provisional until the evidence is reviewable. Check whether the service change appears to affect experience outcomes in your cohort view, and do not rely on margin math alone.
Require a time-bound data-governance check before launch:
- explicit decision owner
- defined review window
- clear roles for data quality and decision rights
- confirmation that finance and ops can tie assumptions to observable cost and incident patterns
Keep modeled savings provisional until realized costs, failed-payment recovery and support effort are visible. Do not recognize savings that assume a legally impermissible delay or use of contractor/customer funds.
Step 4 Sequence by supply risk#
In supply-constrained cohorts, avoid starting with levers that add payout friction. Where payout experience is already stable, start with the least invasive margin lever and keep the test narrow by cohort and market.
Review outcomes in the same weekly cohort framework. If Experience NPS weakens while broader relationship sentiment stays steadier, treat it as an early warning and adjust before scaling.
Handle common failure modes and recover trust fast#
Repair the incident and communication together. A recipient needs an accurate status, a next action where appropriate and a named route to resolution. Recovery may improve trust, but completion alone does not demonstrate that sentiment has recovered.
Step 1 Surface incident signals fast and treat timing as severity#
Use provider alerts, reconciled exception reports and recipient contacts to identify problems promptly. Do not depend on a periodic survey to discover missing money; it is slower and may omit the people most affected.
Define your incident triggers before issues happen, and review them daily. In practice, compare three views for the same payout: what the recipient saw, the latest machine event, and the finance posting. If those views diverge, treat it as an active trust incident.
If your stack uses asynchronous events, for example webhooks, replay controls, or ledger corrections, treat those controls as internal design choices to validate from your own event history, not as claims established by these sources.
Step 2 Patch visible errors quickly and explain status clearly#
Correct status copy when it contradicts the actual payout record, and repair the underlying failure. Keep the promise and incident history visible so a later completion is not reported as an on-time success.
Run recovery on two tracks:
- fix the underlying error path
- communicate current status, required action, and latest update time in plain language
Escalate with the actual contractor deadline in mind, such as a contractual payday or promised release. Explain verified facts and the next update time; do not promise a bank-credit time that your provider cannot confirm.
Step 3 Put finance ownership on aging exceptions#
Assign overdue cases even when their root cause is still unknown. Track current age and number of impacted contractors separately from closed-case averages, which can improve while the hardest cases remain unresolved.
Use a daily exception queue with named finance ownership and aging review. Track at least payout reference, recipient-visible status, latest event time, latest finance action, root cause label, and age. Judge the process by outcomes: whether aged exceptions shrink and whether complaint pressure declines after corrections.
Verify recovery against the original intent, update the recipient and close the case only when its resolution criteria are met. Review whether repeat contacts and unresolved amounts decline; that is stronger evidence than declaring that a fast fix restored loyalty.
Keep compliance and tax steps from becoming loyalty drag#
Prevent payout-day surprises by sequencing compliance and tax requirements before funds are ready to release, then make each hold state explicit.
Step 1 Collect identity and tax inputs before first payout eligibility#
Collect the identity and tax information actually required by the account and payment program at the appropriate setup stage. IRS W-8 requester guidance covers several foreign-status forms, while W-9 supplies US taxpayer identification and certification. Do not request every form from every contractor or assume every missing document legally requires an identical payout hold. Separate program prerequisites, applicable withholding treatment and the contractual payment obligation.
Step 2 Make compliance holds readable and actionable#
Give contractors the information they can act on, while following the applicable legal/compliance restrictions on disclosure. Where permitted, status copy should show:
- the current permitted status, without disclosing restricted investigation details
- whether the contractor must act and the exact permitted next step
- the last update time and when another update is expected
If action is required, name the exact next document or field and link directly to that step. This is the same transparency pattern used in payout incident recovery, and a clear payout tracker helps.
Step 3 Keep tax-document paths specific by cohort#
Do not route all users to one generic tax path. Keep distinct guidance for each supported cohort and treat document collection as an operating branch, not a legal article. The contractor should know which document path applies, why it matters, and whether payout eligibility is blocked until it is complete.
In the reliability dataset, tag tax-document holds by missing document type, review owner, and last contractor-facing update. That lets you compare compliance friction with payout execution instead of treating every delayed release as the same failure mode.
Once a contractor clears the missing input, record the status-change timestamp and monitor whether support pressure or repeat contacts fall in the next review window. That is how you separate solvable compliance friction from true payout-system unreliability.
Step 4 Review blocked cohorts monthly and remove avoidable friction#
Run a monthly blocked-payout review by cohort, reason code, and outcome to confirm controls are reducing risk without creating avoidable abandonment. Track:
- blocked reason (
KYC,KYB,AML, missing tax form, other) - cohort or market
- document requested and received date
- outcome (released, abandoned, still blocked)
- support contacts while blocked
Use this checkpoint to fix timing, copy, or collection flow where holds are avoidable.
Assign operating ownership so improvements stick#
Do not leave payout and experience fixes to "the team." Assign clear owners and review points so decisions, reporting, and follow-through are explicit.
Step 1 Name one owner per layer and document handoffs#
Tie each operating layer to one accountable owner. A practical split can be: product for event integrity, engineering for webhook and idempotency reliability, finance ops for ledger reconciliation, and CX for NPS signal hygiene.
Then make handoffs explicit for every scorecard field: who defines it, who monitors it, and who fixes drift. If a field has no clear owner, ownership is still implied, not operating.
Step 2 Run a standing Net Promoter System review with one required action#
End each review cycle with one action decision, one owner, and one due date. That keeps the meeting tied to execution instead of commentary.
Watch for fragmented reviews across separate meetings. If reliability, NPS splits, and exceptions are reviewed in isolation, treat that as a governance gap and assign a single follow-up owner.
Step 3 Publish one shared scoreboard and link to deeper guidance#
Keep one shared view of payout reliability, NPS splits, and the current exception backlog so the tradeoffs are visible in one place. Include open questions next to the metric they affect.
If the same issue is analyzed in multiple docs, keep one source of truth and link to deeper guidance, such as payout friction.
Copy/paste checklist for your next operating cycle#
Start with defensible evidence, then make decisions. Use this checklist as internal operating discipline, not as proof of causality.
- Record the business payout intent, original promise, attempts and available confirmation evidence.
- Keep due, on-time, late, failed, returned, held and overdue-pending counts at a declared cutoff.
- Document survey wording, invitations, response counts, deduplication and exposure/response windows.
- Aggregate each dataset before joining; recompute NPS from promoter/detractor/valid-response counts.
- Publish the full view beside any exclusion-based slice and investigate concrete incidents without waiting for survey significance.
- End the review with a scoped decision, owner, due date, follow-up and rollback condition.
Frequently Asked Questions
What is the practical link between payout quality and NPS for contractors?
Treat the link as a hypothesis: compare confirmed payout performance with feedback from the exposed contractor cohort, then check complaints and subsequent behavior. Co-movement can identify an operating risk but does not prove causality. Keep missed deadlines and unresolved money visible even when NPS is flat or sparse.
Is NPS enough to judge contractor loyalty, or do we need additional signals?
No. Pair NPS with payout due/outcome counts, response rates, complaint themes, open-case age and repeat-work or departure behavior. NPS measures recommendation intent, not a guaranteed retention outcome. Control sampling and avoid inviting only successful recipients.
Which NPS type should we prioritize first for payout operations: Experience NPS, Relationship NPS, or Competitive benchmark NPS?
Use payout-triggered feedback to investigate an active experience, and a consistent relationship survey to track broader recommendation intent over time. Keep survey wording, exposure, sample and dates explicit. Satisfaction or effort scores should retain their own labels; competitive benchmarks need comparable methods and remain context.
How long should we wait before treating a payout reliability change as a loyalty issue?
Respond to confirmed missing, duplicate or overdue payments immediately. Evaluate sentiment trends using the survey schedule and a sufficiently supported comparison window. A small or unchanged relationship score does not rule out harm, and no single waiting period establishes a causal loyalty effect.
What should founders and finance ops do first if NPS drops after payout incidents?
Trace affected payout intents, promises, provider outcomes, returns and receipt evidence. Help impacted contractors and correct status, then compare exposed respondents, response rates, complaints and other changes. Scope any pause or rollback to the affected decision; do not halt unrelated monetization work solely because one score fell.
How do compliance checks like KYC and AML affect payout reliability metrics without distorting conclusions?
Keep policy holds visible in the full recipient-facing view and show their reasons where disclosure is permitted. A separately labeled execution-only slice can apply documented exclusions, with counts and the full denominator published alongside it. This distinguishes root cause without erasing missed expectations or contractor experience.
Researched and edited by the Gruv editorial team. Gruv builds cross-border billing, payouts, and finance-operations software for global businesses.
Sources
Includes 2 external sources outside the trusted-domain allowlist.
Educational content only. Not legal, tax, or financial advice.
Related Posts

The Freelance Payment Penalty: A Modeled Audit of Platform Fees, FX Spreads, and Payout Delays
The money rarely disappears through a single, easy-to-spot fee. The real loss is stacked. A marketplace takes its commission, a processor adds a charge for international cards, a bank or payment company converts the currency at a spread, a platform holds the funds before release, and a wire sheds a little to intermediaries on the way in. Each layer looks defensible on its own, but the worker feels the combined result as a smaller deposit and a later payday.
How to Respond to a Subpoena for Business Records
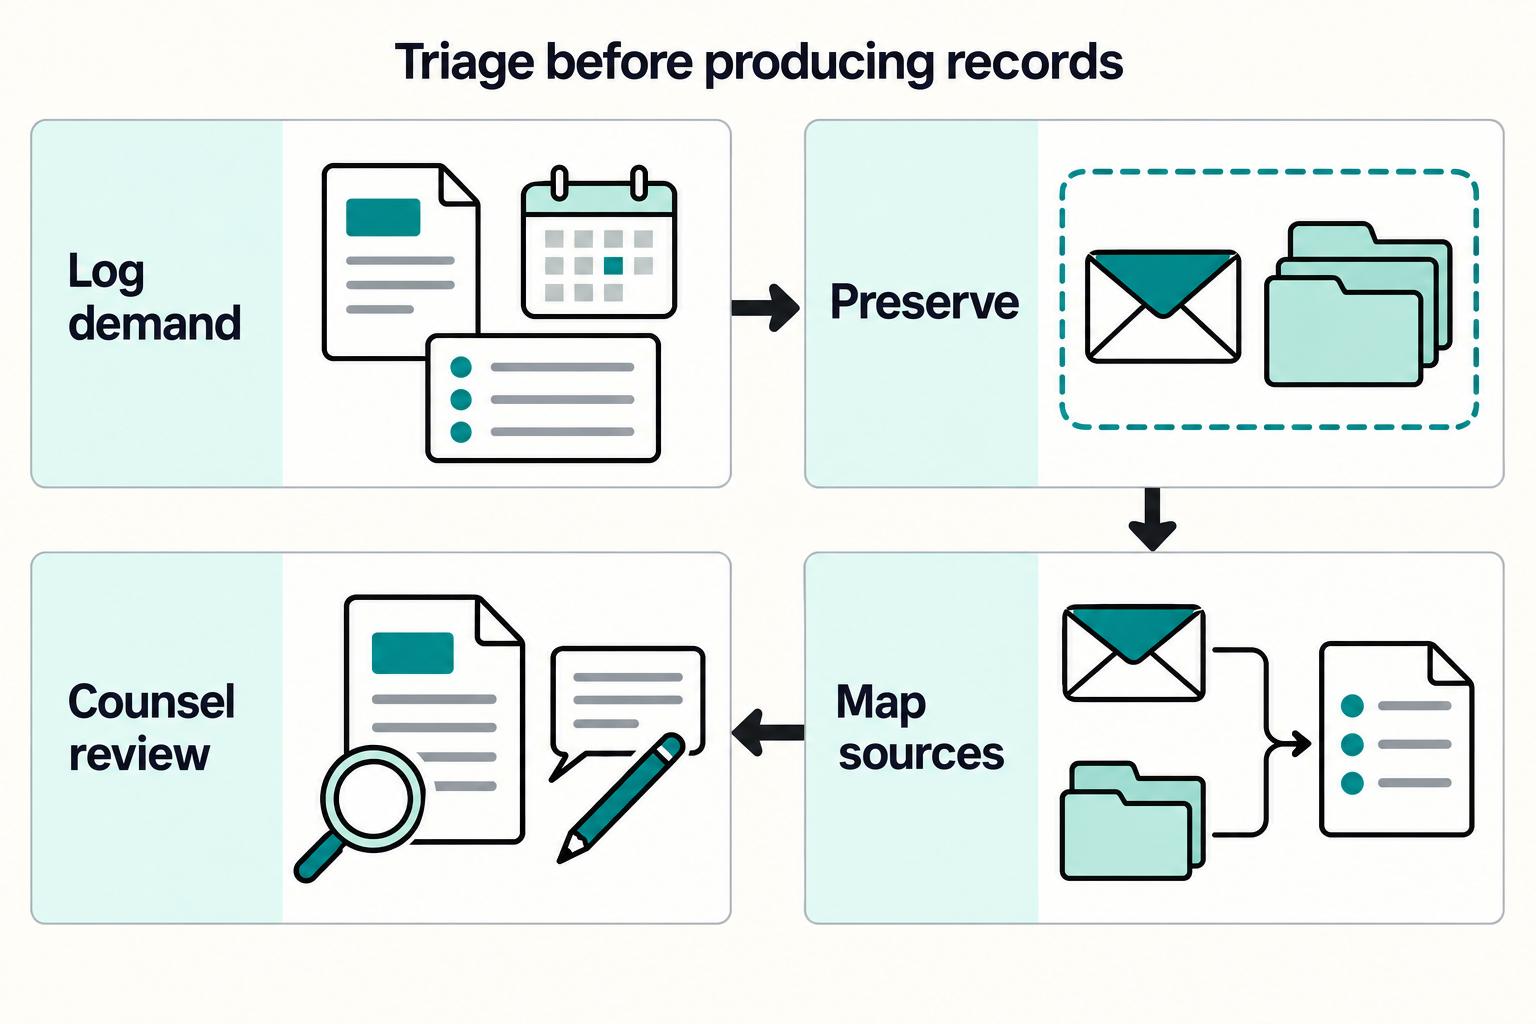
Move fast, but do not produce records on instinct. If you need to **respond to a subpoena for business records**, your immediate job is to control deadlines, preserve records, and make any later production defensible.
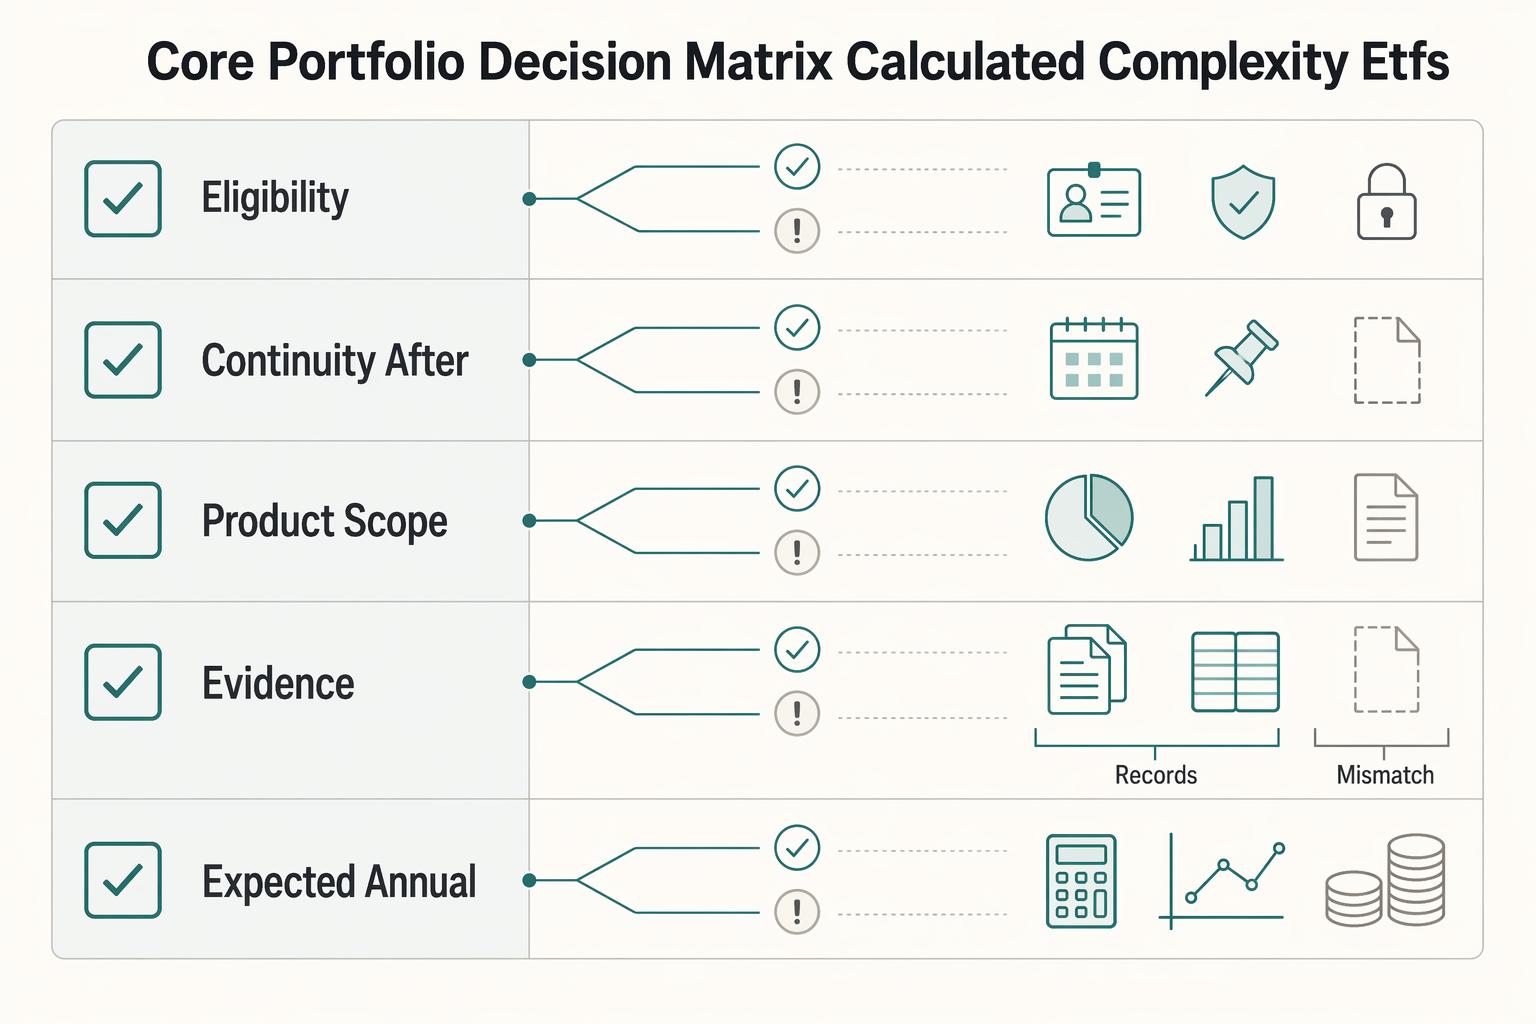
A US Expat's Guide to Investing in UCITS ETFs to Avoid PFIC Issues
The real problem is a two-system conflict. U.S. tax treatment can punish the wrong fund choice, while local product-access constraints can block the funds you want to buy in the first place. For **us expat ucits etfs**, the practical question is not "Which product is best?" It is "What can I access, report, and keep doing every year without guessing?" Use this four-part filter before any trade: