
Quick Answer
Define customer, subscription, and revenue metrics separately; split voluntary exits from payment-related loss. Diagnose comparable paid cohorts, correct billing faults, and test the supported remedy. Evaluate offers using incremental contribution after service and incentive costs, with explicit limits and mature renewal follow-up.
Churn is an economics problem before it is a growth problem#
Subscription churn measures paid subscribers lost within a defined period. It cuts recurring revenue, makes planning less reliable, and creates replacement acquisition costs. Whether retention is cheaper than replacement depends on the segment and the intervention cost.
Stabilize measurement, separate voluntary from involuntary exits, and rank fixes by incremental contribution. Pricing changes, save offers, and win-back campaigns can improve account retention while weakening the economics.
Agree on the formula and reporting window for each metric, with a shared dashboard. Separate voluntary churn from payment-related loss because the remedies differ.
Measure churn correctly#
Verification point: product, revenue, and finance can reproduce each metric from the same events, customer identifiers, and reporting rules.
Investigate root causes by cohort#
Failure mode to avoid: treating every cancellation as the same problem when churn can have distinct causes.
Prioritize interventions by unit economics#
Decision rule: if a save tactic only works by giving away too much value, it is not really fixing churn.
Run a regular retention review#
Evidence pack to prepare: churn trend, cancellation reasons, journey drop-off points, and current pricing by segment.
Streaming examples in this article concern subscription video on demand (SVOD), including ad-supported paid plans. They illustrate specific consumer subscription patterns. Software, media, and other platforms should compare equivalent paid cohorts, billing cadences, and markets before adopting a tactic or benchmark.
Set the baseline before you try to fix churn#
Set your measurement baseline before you touch tactics, or you will optimize the wrong outcome.
| Metric | Calculation for a fixed starting paid cohort | Reporting rule |
|---|---|---|
| Subscription churn | Paid subscription units lost / starting paid subscription units | Define whether the unit is a subscription or unique subscriber; exclude new entrants |
| Customer churn | Customers losing their last paid subscription / starting paid customers | Count each customer once; a partial plan cancellation may leave the customer active |
| Gross revenue retention (GRR) | (Starting MRR − cancellation MRR − contraction MRR) / starting MRR | Exclude new customers and existing-customer expansion |
| Net revenue retention (NRR) | (Starting MRR − cancellation MRR − contraction MRR + expansion MRR) / starting MRR | Include expansion within the starting customer cohort; document reactivation treatment |
| Gross revenue churn | (Cancellation MRR + contraction MRR) / starting MRR | Use the same cohort, currency basis, and window as GRR |
For an illustrative monthly cohort of 100 paying customers, five lost customers mean 5% customer churn. Starting monthly recurring revenue (MRR) of $10,000, $1,000 lost to cancellation, $500 to contraction, and $2,000 of existing-customer expansion produce 85% gross revenue retention (GRR), 105% net revenue retention (NRR), and 15% gross revenue churn. New-customer revenue is excluded from these retention calculations.
Keep one documented definition per metric, including treatment of trials, past-due accounts, reactivation, and cancellation effective dates. A renewal cancellation notice is not necessarily immediate loss of paid access. Stripe Billing uses a rolling 30-day subscriber churn denominator that includes both starting active subscribers and new subscribers during the window; it is different from the fixed starting-cohort definition above. Reconcile provider reports through those rules rather than forcing unlike formulas to match.
Break results out by first-paid cohort, plan tier, billing cadence, and tenure. Track signup-to-paid conversion separately. Compare cohorts at the same age and with equivalent renewal opportunities; flag immature cohorts instead of treating incomplete follow-up as improved retention. A plan switch is not customer loss if another paid subscription remains active. For execution detail, see subscriber segmentation.
Before a discretionary retention test, record the assumed lift, incremental contribution, incentive cost, and uncertainty. A bounded experiment can test uncertain assumptions; it cannot establish them in advance. Continue necessary billing corrections while preparing this evidence. For earlier detection, see churn prediction.
Prepare the evidence pack and operating owners#
Before you test any fix, lock the evidence pack and decision rights so you can separate real product-value churn from other exits.
| Checkpoint | Requirement |
|---|---|
| Launch date | Define before launch |
| Target segment | Define before launch |
| Primary success metric | Define before launch |
| Rollback trigger | Define before launch |
| Guardrail metric | Include an adverse threshold that can pause the test |
| Decision owner | Name the owner for pause/continue calls |
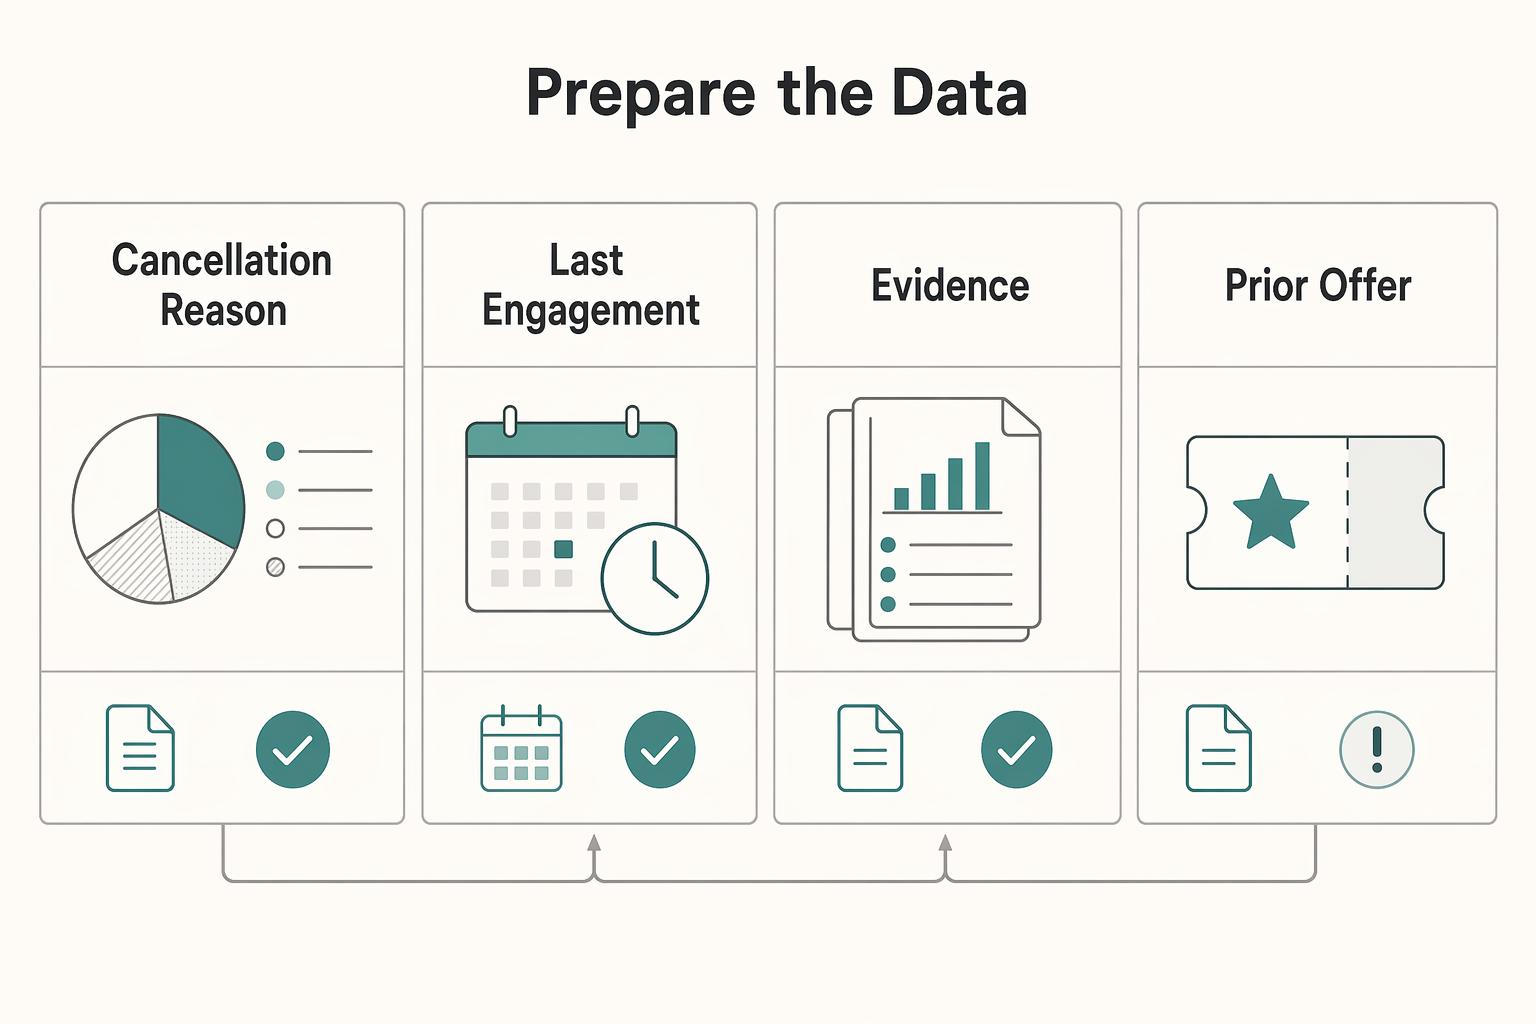
Start with a minimum evidence pack for each flagged segment:
- churn rate trend
- cancellation reasons
- customer journey drop-off points
- current pricing model by segment
- invoice and subscription state with effective event dates
- test eligibility, contribution assumptions, and incentive budget
Cancellation reasons, support tickets, and usage patterns provide hypotheses about exits. They do not establish causation on their own. Compare timelines and, where feasible, test the proposed remedy against a control group.
Assign clear owners and approvals across product, revenue, and finance. Keep it explicit: who owns journey breakpoints and pre-churn behavior, who owns cancellation taxonomy and save or discount motions, who signs off on unit-economics assumptions, and who can approve discounting.
Where required identity or business checks apply, tag verification bottlenecks separately from dissatisfaction. Know Your Customer (KYC), Know Your Business (KYB), and anti-money-laundering (AML) obligations depend on the business and jurisdiction; they are not universal subscription requirements. Never bypass a required check to improve conversion. Abandonment before paid activation belongs in the onboarding funnel, not paid subscriber churn. Signicat’s historical financial-services surveys reported abandonment increasing from 40% in 2016 to 68% in 2022; its 2022 study surveyed 7,600 European consumers. Those are different survey years, not a tracked subscriber cohort or a current platform churn benchmark.
Before launch, define verification checkpoints for every experiment:
- launch date
- target segment
- primary success metric
- rollback trigger
- at least one guardrail metric with an adverse threshold that can pause the test
- named decision owner for pause or continue calls
If those checkpoints are not written down, the test is not ready. For a step-by-step walkthrough, see How to Calculate and Manage Churn for a Subscription Business.
Map churn to customer journey breakpoints#
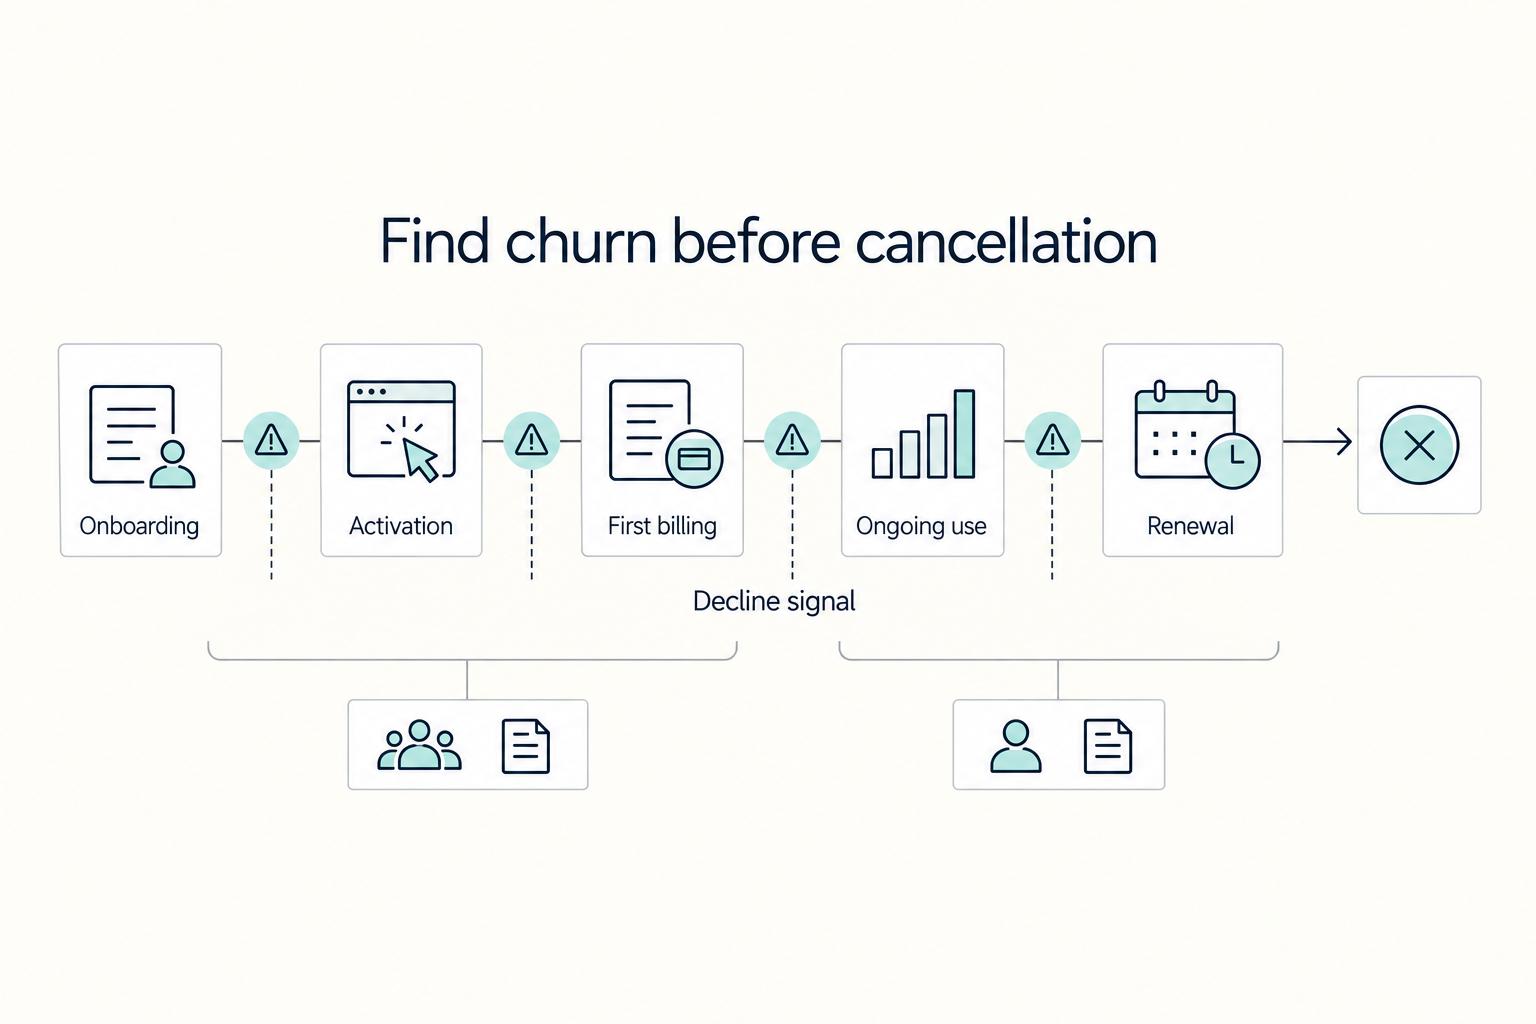
Map the first observed decline signal and the eventual cancellation or paid-access loss separately. Use the stage pattern to choose a hypothesis, owner, and test; the signal alone does not determine the cause.
Map acquisition, signup, onboarding, activation, first billing, ongoing use, and renewal. Tag the cancellation request, effective paid-access loss, and first visible decline signal for each affected account. For voluntary exits, compare reason feedback, support history, and usage. The diagram shows places to investigate; it does not establish causal links or define when churn occurs.
Run this stage analysis by cohort, segment, and tenure instead of relying on blended averages. A stable average can hide early-stage churn in newer cohorts while older cohorts hold the topline steady.
| Stage | Leading indicator | Hypothesis to test | Retention lever | Owner | Verification checkpoint |
|---|---|---|---|---|---|
| Signup to onboarding | High drop-off before setup completion | Onboarding friction | Remove setup friction and tighten first-run path | Product | Setup completion rises; verify subsequent paid activation separately |
| Onboarding to activation | Low early feature use | Value not clear for that segment | Clarify first-value steps and segment onboarding guidance | Product | Activation rises and "how do I start" tickets fall |
| First billing cycle | Cancellations cluster around first charge | Plan mismatch, price surprise, or weak early value | Improve pre-billing expectations and trial-to-paid transition before broad discounts | Revenue + Product | First-cycle retention improves without eroding margin through incentives |
| Ongoing usage | Engagement fades before cancellation | Value erosion or unresolved service friction | Trigger re-engagement and service recovery on decline signals | Product / CS | Usage recovers before renewal |
| Renewal or late tenure | Cancellation at renewal after long prior use | Plan-value fit changed over time | Targeted renewal save motions with finance review | Revenue + Finance | Incremental contribution after incentives and delivery costs is positive in the target cohort |
If you need a deeper segmentation pass, this is where subscriber segmentation becomes operational.
RevenueCat’s 2025 report, drawn from its subscription-app dataset of 75,000 apps and more than $10 billion in tracked revenue, says nearly 30% of annual subscriptions are canceled in the first month. This concerns cancellation of future renewal, not necessarily loss of current annual access. Antenna’s Q1 2024 Premium SVOD benchmark reports weighted monthly churn during 2023 of 8.6% for subscribers in their first tenure year versus 4% in their second. These historical, model-specific figures support tenure segmentation; they do not prove an onboarding cause or that keeping any customer for a year will halve their risk.
If decline appears before customers reach value, test journey and expectation-setting problems. After sustained use, investigate changing needs, service quality, plan fit, and price. Choose the remedy from the evidence rather than the timing alone.
Prioritize retention bets with unit economics first#
Rank work by incremental contribution protected, implementation effort, and evidence quality. Separate an early behavioral signal from paid retention over a complete renewal window.
Rank options by protected revenue, not just saved accounts#
Review average revenue per user (ARPU), estimated lifetime value (LTV), GRR, and NRR by paid cohort and plan. State the observation window and LTV assumptions; a forecast is not realized contribution or permission to spend without a limit.
As an illustration, start with 100 customers and $10,000 MRR. If 37 high-spend customers representing $9,000 leave and no other revenue changes occur, 63% of customers remain but only 10% of starting revenue remains. This is a hypothetical comparison, not an observed cohort benchmark. Account counts alone would miss the severity of that loss.
Keep scoring simple and consistent across ideas:
- expected impact on churn rate or revenue churn
- expected economic effect after discounts, credits, or service cost
- implementation effort
- time to signal in the target cohort or plan
Name a target segment, included plans, eligibility rules, and first-read date for each test. These choices make the comparison reproducible and keep incentives within the agreed budget.
Compare bets in a decision table before you build anything#
Use one decision table to make tradeoffs explicit before execution.
| Retention option | Best fit segment | First signal and confirmation | Economic risk | When to prioritize |
|---|---|---|---|---|
| Onboarding fix | New cohorts with early drop-off and weak activation | Setup behavior can change early; paid retention needs renewal follow-up | Low direct incentive cost | When churn starts before users reach value |
| Subscription flexibility change | Plans with clear fit mismatch or avoidable exits tied to commitment structure | Observe plan and billing behavior, then the relevant renewal | Moderate, depending on downgrade or term-change effects | When plan-level analytics show concentrated retention weakness in one design |
| Pricing model adjustment | Segments where perceived value and pricing structure are misaligned | Follow conversion, contribution, and renewal over the test window | High if cuts are broad or permanent | When evidence points to pricing structure rather than onboarding friction |
| Win-back campaign | Churned cohorts with prior value and a plausible return case | Observe reactivation, then subsequent paid renewal and contribution | Moderate to high if incentives are broad | When the segment had meaningful LTV before churn and the reason appears reversible |
Plan structure, tiering, and usage pricing influence who buys and how long they stay, so pricing and flexibility belong in the same decision process as product fixes.
Apply a hard finance gate before launch#
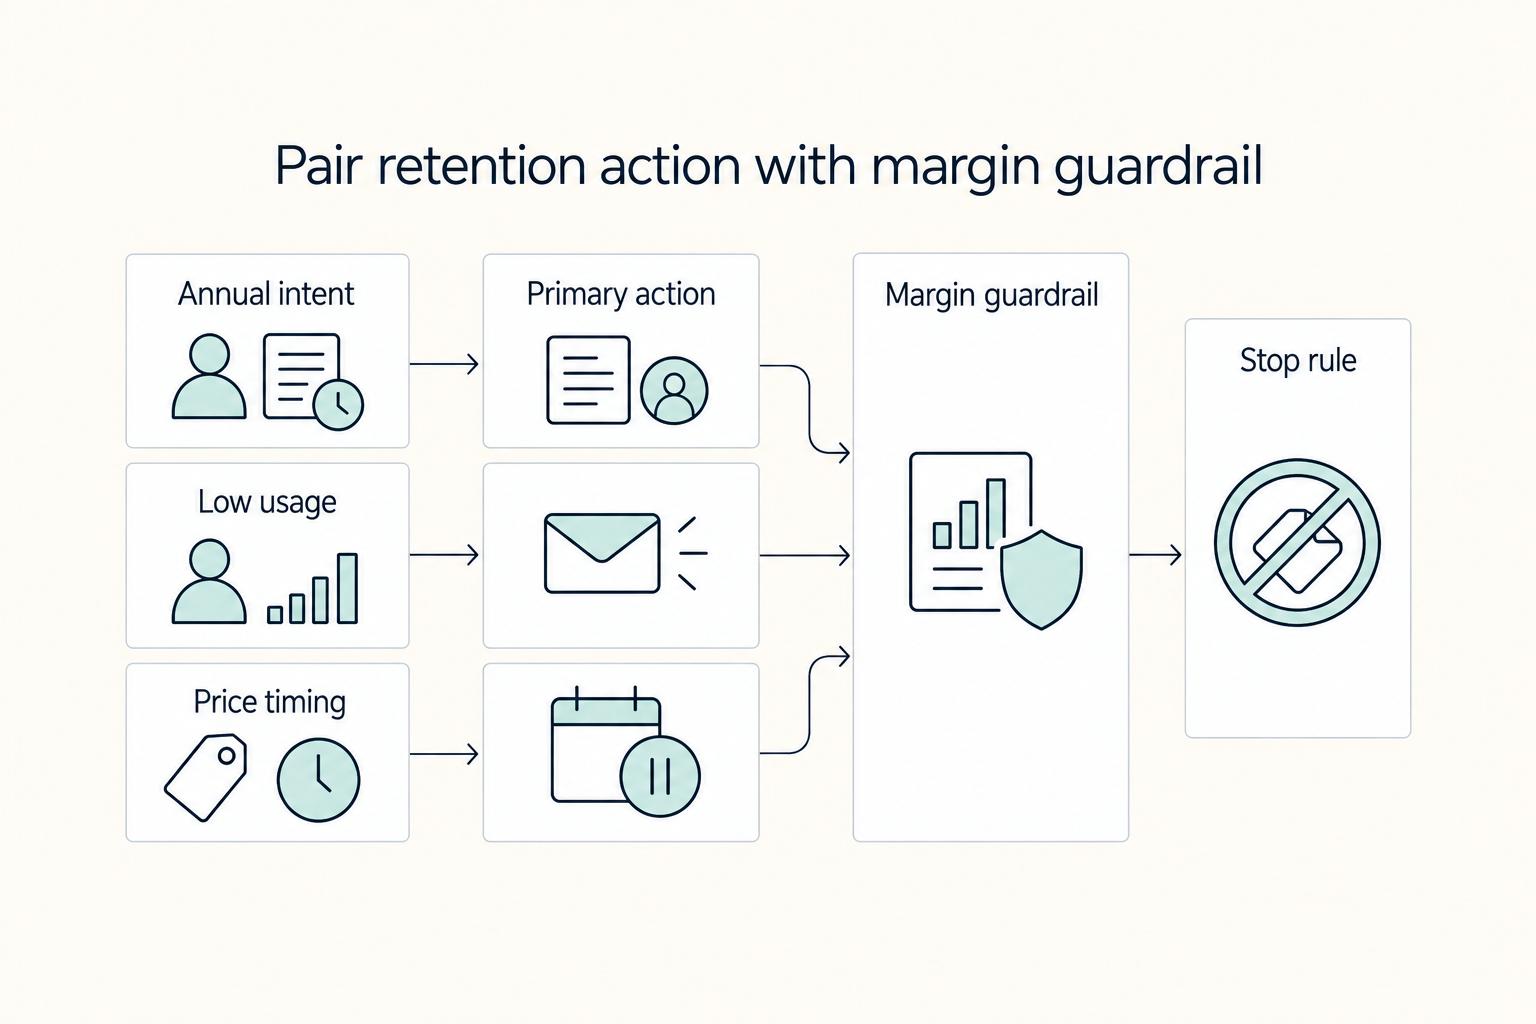
Evaluate incremental contribution after incentives and delivery costs, including discounts given to customers who would have stayed anyway. Stripe’s analytics subtract permanent recurring discounts from MRR; other discount settings can vary. Document your reporting treatment as well as the cash cost.
Lower-value segments may favor low-cost fixes. Higher estimated LTV can support a larger test budget, but does not prove an offer pays back. Finance should approve the assumptions, observation window, downside limit, and stop condition.
Record projected incremental revenue, service and incentive costs, expected GRR or NRR movement, review date, and stop condition. Use a randomized eligible-account control where feasible; otherwise state the limits of the comparison.
Worked example: randomly assign 100 eligible renewal accounts to each arm. Suppose 40 control accounts and 50 offer accounts buy and complete a three-month paid term; the remaining accounts decline and generate no term revenue or delivery costs. At $20 monthly revenue and $5 monthly delivery cost, each renewed account contributes $45 before incentives. A one-time $10 discount to each of the 50 renewed offer accounts leaves $1,750 contribution, versus $1,800 in the control: renewal rises 10 percentage points but contribution falls $50. Additional campaign costs would reduce it further. This illustration assumes equal observation windows and no other revenue differences.
Execute fixes in the right order#
Route work to the observed problem. Correct billing faults promptly; test activation fixes when early users fail to reach value; test pricing or save offers where evidence supports plan mismatch. Weak activation and failed collection can resemble price sensitivity.
Fix activation and recoverable billing friction first#
Separate subscribers who never reached value from those who did and chose to leave. Early drop-off suggests investigating setup friction and expectations, but also price, audience fit, and service failures before choosing a remedy.
For eligible failed card payments, Stripe Smart Retries can automate recovery. Stripe excludes cases with no available payment method, hard declines, India-issued cards, or a disconnected Connect account. Hard declines require a new payment method before a charge can execute. Update the method at the correct subscription or customer level: replacing a customer default alone will not override an existing subscription default. Confirm the invoice and subscription state, stop collection once paid, and reconcile events before sending further payment requests.
Before launching any pricing test, review activation, failed payments, and recovered payments together for the same cohort. That helps you avoid misdiagnosing first-cycle churn.
Add flexibility selectively, then test save offers narrowly#
Offer flexibility when temporary strain or plan mismatch is supported by the evidence. Specify what a pause changes: billing, access, outstanding invoices, renewal timing, and the resume date. Pausing collection and pausing a subscription can have different effects. Test pause and resume end to end, and do not count paused non-paying accounts as retained paid revenue merely because the account remains registered.
Make cancellation straightforward. Offer optional reason feedback and a relevant alternative without requiring a survey or forcing a pause. Feedback informs a hypothesis; it does not by itself validate the cause.
Then keep save tests tight: one segment, one reason pattern, one offer type. Avoid broad discounts until segment-level evidence is stable.
Connect billing, cancellation, and usage signals before anyone intervenes#
Interventions work better when you view billing behavior, cancellation signals, support context, and product engagement together. Stripe Billing or Recurly data is part of that picture, but teams usually need additional integration to get a full view.
Route action using current billing status, optional cancellation feedback, recent activity, and support history. Join these records by stable account and subscription identifiers. Separate repeated retry events from distinct failed invoices and reconcile late or duplicate events before acting.
Stand up early warning and win-back systems#
Start retention work before cancellation. Once root causes are clear, the next move is to detect risk early, route accounts by likely cause, and run win-back in a way that restores durable revenue, not short-lived reactivations.
Build the signal set and route accounts by likely problem#
Use behavior changes, billing events, and support history to flag risk. Calibrate alerts against observed outcomes and review false positives. A usage dip, failed payment, and support escalation need different responses; predicted risk is not a proven cause.
Give billing failures a dedicated recovery lane with eligibility checks and current invoice state. Retry automation is a remedy, not proof of an early-warning model’s accuracy. Route valuable accounts with meaningful service context to personal outreach rather than another generic message.
Verification checkpoint: before any account enters a retention queue, confirm you have recent usage, current billing status, and open or recent support context. The common failure mode is treating every activity dip as equal risk and flooding teams with low-quality alerts.
Set response SLAs by risk tier and keep humans where they matter#
Match effort to risk, account value, and likely remedy. Automated payment-update prompts or usage reminders can handle suitable cases; respect contact preferences. Use human outreach for consequential unresolved billing or service issues, rather than prioritizing solely by spend.
Include account value, likely reason, and available remedy in the watchlist. Automation can handle eligible routine cases; a person should resolve ambiguous account state, service complaints, and exceptions to offer authority.
Assign an owner, channel, response window, and capacity for each tier. For example, a team might review hard-decline cases the same business day and low-usage alerts within two business days. These are illustrative service targets, not industry standards. Monitor overdue cases and narrow noisy alerts when the queue exceeds capacity.
Segment the win-back campaign by reason and timing, then measure recovery quality#
Segment win-back by reason and time since effective exit. Billing recovery can begin within the configured recovery window; voluntary win-back should reflect the reason, contact permission, and whether the product issue has been resolved. Suppress accounts already returned. Recurly’s 2025 reporting cites returning subscribers as 20% of new acquisitions. That aggregate share is not a campaign’s causal lift or the probability that an individual former subscriber returns.
At minimum, split paths by billing failure, lack of use, and plan or budget mismatch. If the exit was payment-related, lead with account recovery. If it was lack of use, lead with missed value or better-fit plan framing, not default discounting. A single generic stream across all churn reasons is usually a warning sign.
Define recovery by an explicit failed-invoice cohort and observation window. In a hypothetical 14-day window, 100 initially failed invoices totaling $10,000, with 40 later paid totaling $3,000, give 40% invoice-count recovery and 30% value recovery. Count each invoice once, separate refunds and fees, and do not use retry attempts as the denominator. For win-back, measure contribution and paid retention through the next relevant renewal, not reactivation alone.
If you want a deeper dive, read Win-Back Campaigns for Platform Operators: How to Re-Engage Churned Subscribers Automatically.
Avoid the common churn traps and recover fast#
False progress usually comes from the wrong metric or weak test governance. Headline churn can improve while revenue quality declines.
Track loss by account value, not just logo count#
Review customer churn and revenue churn together in every retention readout. Customer churn shows how many accounts left, while revenue churn shows how much subscription revenue was lost through cancellations or downgrades. If you only track logo count, you can retain lower-spend accounts and still lose meaningful revenue when premium subscribers leave.
Break results out by plan, tenure, and account value, then show retention, revenue loss, and contribution by segment. Compare eligible control and test accounts at equivalent cohort ages and renewal opportunities. A company average alone cannot establish the effect.
Before borrowing a streaming tactic, check billing cadence, tenure, geography, audience, sales motion, and economics. The historical RevenueCat and Antenna examples describe specific populations and different events. Compare your own equivalent cohorts rather than adopting an unmatched industry average as a target.
Freeze weak or disputed tests before they spread#
Set an incentive stop-loss before launch. Pause immediately if a hard guardrail is breached. Two consecutive weak readouts can be an additional review trigger when no hard threshold has been crossed; they are not a reason to tolerate a known loss or customer harm.
If a definition, eligibility rule, or owner is disputed, pause the affected discretionary test until the comparison is reliable. Continue necessary billing fixes and straightforward cancellation. Keep uncertainty visible instead of scaling a result that appears positive in only one dashboard.
You might also find this useful: How to Use a Community to Reduce Churn and Increase LTV.
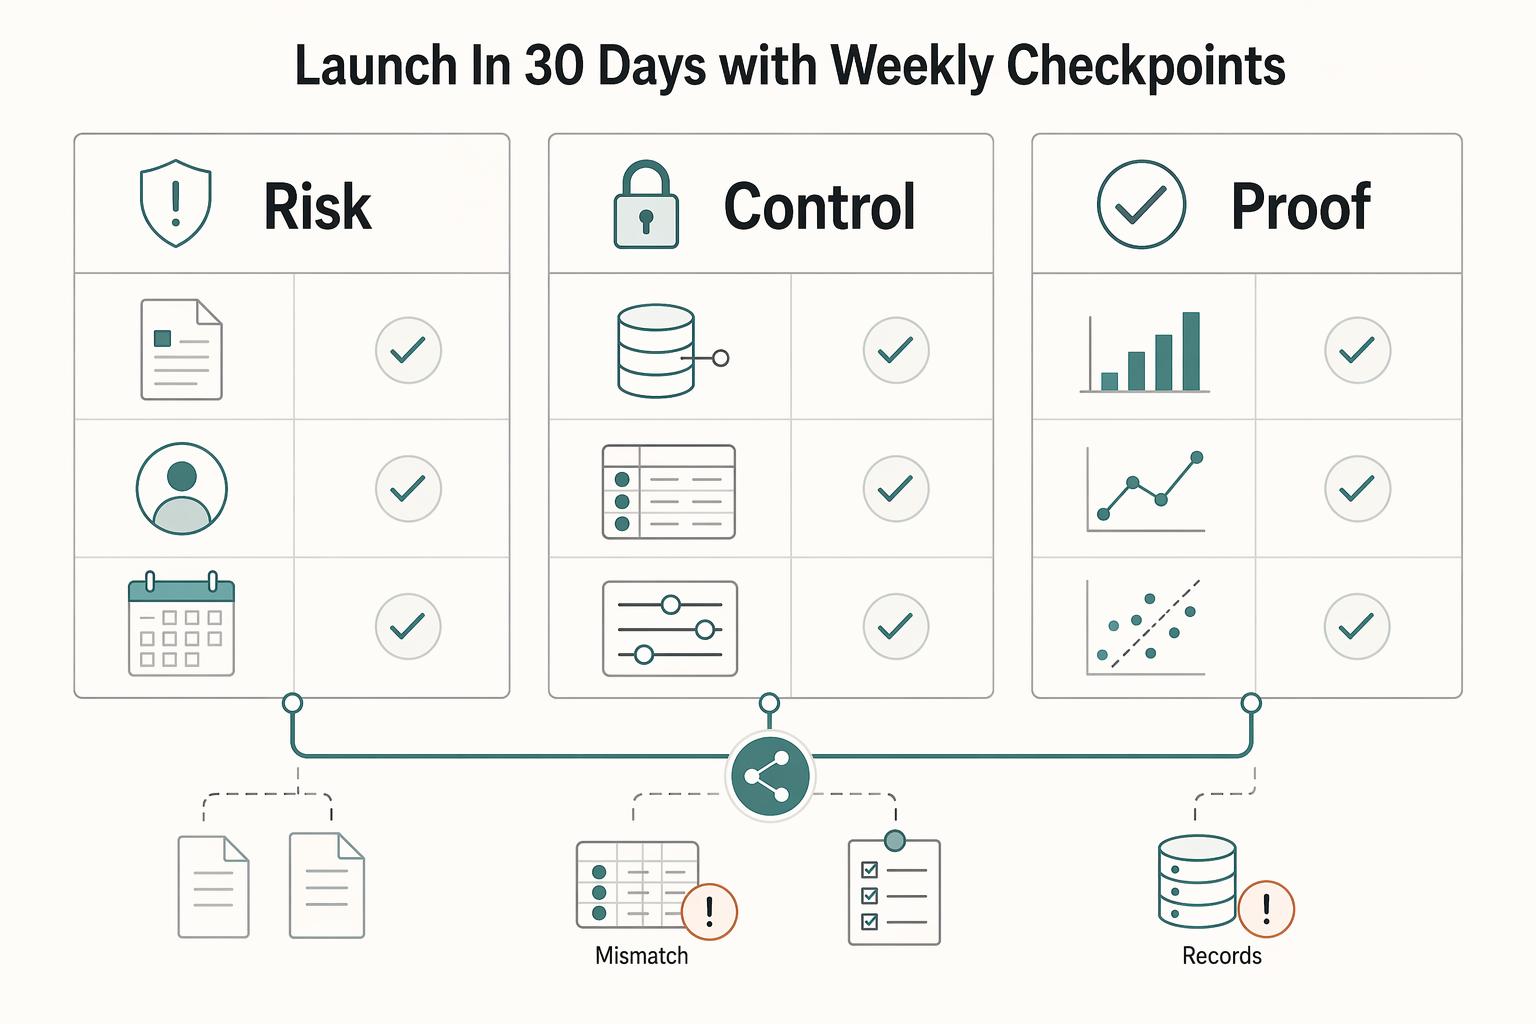
Your first 30 days: establish measurement and bounded tests#
Use the first month to establish definitions, investigate cohort patterns, and launch bounded tests. Annual renewal retention and long-term margin may take much longer to observe; early usage or cancellation-intent changes are preliminary signals.
| Week | Focus | Key action |
|---|---|---|
| Week 1 | Lock definitions and owners | Freeze shared definitions for subscriber churn, customer churn, revenue churn, and NRR |
| Week 2 | Segment cohorts and map breakpoints | Run cohort retention analysis by onboarding cohort, plan tier, and tenure |
| Week 3 | Launch bounded tests | Test supported activation or billing fixes; save offers need evidence and a budget |
| Week 4 | Review signals and guardrails | Review economics and early results; wait for mature renewal evidence before scaling |
Use a shared reporting window and source events, with an owner for each metric definition. Track trends alongside mature test results, and keep finance involved in contribution and incentive decisions.
Week 1: lock definitions and owners#
Document customer and subscription churn, GRR, and NRR separately, including effective cancellation dates, new-customer exclusions, and treatment of pauses and past-due accounts. Verify that teams reproduce each metric from the agreed rules; reconcile vendor differences explicitly.
Week 2: segment cohorts and map breakpoints#
Analyze first-paid cohorts by plan, cadence, and tenure at equivalent ages. Tag the first observed decline and effective exit separately. Select retention hypotheses by evidence, expected contribution, effort, and time to a meaningful result.
Week 3: launch bounded tests#
Launch bounded tests matched to the diagnosed problem, such as an activation fix or eligible billing recovery. Use a save offer only with a supported reason and budget. Define success, guardrails, and rollback triggers before launch.
Week 4: review signals and guardrails#
Review retention, contribution, and guardrails together. Use an eligible control where feasible, equivalent cohort ages, and a complete relevant renewal window before claiming durable improvement. A before-and-after trend alone can reflect seasonality or customer mix. Stop at hard thresholds and retain immature results as pending.
Use this checklist:
- Define churn, revenue churn, and NRR in one shared dashboard
- Segment first-paid cohorts by billing cadence, plan tier, and tenure
- Map observed journey signals and test root-cause hypotheses
- Rank bets by expected retention lift, economic impact, effort, and time to signal
- Test remedies matched to the diagnosed cause with an eligible control where feasible
- Verify economics with guardrails and rollback logic
- Stop weak tactics quickly and keep only what improves retention and unit economics together
Keep the operating loop connected: the same account events should explain paid retention, collected revenue, incentive cost, and the next action. Scale when the mature comparison supports both customer value and acceptable economics.
Frequently Asked Questions
What is the best first step to reduce subscriber churn on a platform?
Document a separate formula for customer loss, subscription loss, and revenue retention, with a common reporting window and shared source events. Reconcile billing-provider definitions before comparing dashboards. Split voluntary exits from payment-related loss and investigate the dominant paid cohort issue.
How do we identify high-risk subscribers before cancellation without overreacting to noise?
Use multiple signals, not one dip in usage. Combine product usage, support tickets, email engagement, and other relevant signals such as billing issues and, where you have it, sentiment from chats or conversations. In practice, accounts are easier to prioritize when more than one signal family is moving.
Which churn fixes usually help retention without hurting unit economics?
Start with a supported source of friction: activation problems, billing faults, or a mismatch in plan design. Payment recovery requires provider and payment-method eligibility checks. Optional exit feedback can guide voluntary-retention tests. Measure incremental contribution because even targeted offers can reduce margin.
How often should product and finance review churn and revenue churn together?
Use a fixed review cadence tied to your billing cycle and experiment volume, not an arbitrary universal rule. Review customer churn and revenue churn in the same meeting before you scale any offer, pricing change, or lifecycle fix. If one team is looking at logo retention while the other is looking at lost subscription revenue later, you are already behind.
Should we prioritize onboarding fixes or pricing model changes first?
Prioritize the cause supported by your own cohort evidence. Recurly’s 2025 subscriber research reports 66% of cancellations in the first 12 months, but timing does not establish an activation problem. Verify early value, payment failures, expectations, and plan fit before choosing onboarding or pricing changes.
When is a win-back campaign worth running versus focusing only on active subscribers?
Run a bounded win-back test when the former cohort has a reversible exit reason and a credible contribution case. Recurly’s 2025 reporting cites a 20% returning-subscriber share of new acquisitions, which does not establish campaign lift. Compare eligible test and control accounts, and avoid recruiting customers back into an unresolved service problem.
Try a related tool
Researched and edited by the Gruv editorial team. Gruv builds cross-border billing, payouts, and finance-operations software for global businesses.
Sources
Includes 6 external sources outside the trusted-domain allowlist.
- docs.stripe.com/billing/subscriptions/analyticstrusted
- docs.stripe.com/billing/revenue-recovery/smart-retriestrusted
- antenna.live/insights/why-subscriber-tenure-mattersexternal
- recurly.com/blog/strategies-to-reduce-and-prevent-subscr...external
- recurly.com/blog/customer-winback-strategies-for-subscri...external
- revenuecat.com/docs/web/web-billing/subscription-lifecycleexternal
- revenuecat.com/state-of-subscription-apps-2025external
- signicat.com/the-battle-to-onboard-2022/abandonment-to-fi...external
Educational content only. Not legal, tax, or financial advice.
Related Posts
How to Use Subscriber Segmentation to Reduce Churn on Your Platform
Treat subscriber segmentation work as an economics decision, not only a targeting exercise. If a segment does not help you reduce **revenue churn** or improve recurring-revenue outcomes, it is probably adding complexity without changing the business outcome.
Win-Back Campaigns That Reactivate Churned Subscribers Without Margin Loss
Assume from the start that a win-back flow can lift reactivations and still be a bad trade. If you do not measure what those returns cost in incentives and short-term re-churn, you can end up celebrating activity that does not help the business.
AI-Driven Churn Prediction for Platforms Before Subscribers Cancel
A churn score matters only if it changes what you do before a subscriber leaves. If the output lives in a dashboard and never affects pricing, outreach, feature access, or support treatment, you do not have a retention motion. You have a reporting artifact.