
Quick Answer
Start by fixing one reporting period and one start-of-period customer base, then compute churn with lost customers divided by starting customers multiplied by one hundred. For how to calculate churn in a way you can trust, keep the same boundaries and input rules every cycle, and track account loss and recurring revenue loss as separate views. After calculation, review CLV and CAC before acting so your response matches cashflow risk rather than dashboard noise.
Stop guessing at churn and run a cashflow control system#
If you treat churn as a report you glance at after month end, you find the problem after cash flow has already tightened. Turn churn from an after-the-fact metric into a repeatable control loop so you can protect renewals, keep forecast confidence, and reduce the pressure to buy replacement revenue.
Step 1 Reframe churn as an operating signal#
Churn rate tracks customer or revenue loss over time, and high churn points to retention problems. In practice, that means it is not just a scorecard item for your subscription business. It is an early warning that recurring income may weaken before topline revenue makes the problem obvious.
Silent attrition usually shows up first in account behavior, billing patterns, or operational friction. If you wait for revenue alone to confirm the issue, you may already be carrying months of avoidable damage. The cost is not only lost renewals. Forecasting can get less reliable, sales targets can get harder, and acquisition pressure rises because new customers have to replace avoidable loss.
A useful control loop starts with unified customer data across behavior, transactions, and operations. If cancellations sit in billing, engagement sits in product data, and save attempts sit in support notes, you will miss the pattern. A common failure mode is treating all exits as one bucket when voluntary and involuntary churn should be tracked separately.
| Guessing behavior | Control-system behavior | Immediate business consequence |
|---|---|---|
| You debate the definition every cycle. | You lock one churn definition and reuse it. | Trend lines become comparable, so renewal risk is easier to trust. |
| You wait for revenue to dip. | You track churn alongside leading signals before the dip. | You can act before acquisition pressure becomes unsustainable. |
| You look at churn in isolation. | You review it with CLTV, repeat purchases, and time-to-churn. | You can judge whether the loss is shallow, concentrated, or compounding. |
| You use churn as a dashboard number. | You forecast churn impact on subscription revenue and cash runway. | You can see whether retention issues threaten operating flexibility. |
Step 2 Build a repeatable control loop#
Keep this simple. Pick a short KPI set, often 5 to 7 measures, and make churn one of the few numbers that triggers action. The next sections will help you set scope, calculate it correctly, and diagnose what is driving it. For now, the important shift is ownership and consistency: one definition, one reporting cadence, one source set, and one person accountable for closing the loop. That gives you a clean handoff into the setup work, because most churn mistakes start before the math.
Before you start#
Before you calculate anything, use these checkpoints:
| Checkpoint | Ready when |
|---|---|
| Define recurring revenue scope | Your customer list clearly separates recurring or renewal-based revenue from one-off project work. |
| Assign metric ownership | One named owner can pull the same inputs each cycle and explain any change in source data. |
| Lock the rules | Your team can state, in writing, what counts as churn, what does not, and how voluntary versus involuntary exits are tagged. |
If your KPI baseline is still messy, clean that up first with How to Set and Track KPIs for Your Freelance Business.
If you want a deeper dive, read Digital Nomad Health Insurance: A Comparison of Top Providers.
What should you prepare before calculating churn?#
Do not run churn math until you have three things locked: one owner, one reporting period, and one written set of definitions. Your setup is correct when the same inputs produce the same output every time.
| Setup item | What to prepare | Article note |
|---|---|---|
| Owner and period | Choose one person to pull the data and explain any source changes; lock one reporting window (monthly, quarterly, or annual). | Your trend stays comparable, and calculating outside renewal windows can create forced churn artifacts. |
| Metric dictionary | Document exactly what each metric means in your business and what counts as a loss. | There is no universal churn definition. |
| Minimum dataset and governance | Prepare beginning-of-period and end-of-period customer counts, plus the list of lost customers; keep one working source, one period-label format, and keep segment tags explicit and stable. | Comparisons do not drift between runs. |
| Segment economics and cross-border metadata | Review CLV and CAC by segment; if billing or payouts cross borders, add billing country, invoicing location used, currency, payout destination, and a jurisdiction_check_status field with values such as verified or pending. | Prioritize intervention where retention loss and acquisition cost hurt most and keep records interpretable. |
1) Assign one owner and fix one period. Choose one person to pull the data and explain any source changes. Then lock one reporting window (monthly, quarterly, or annual) before calculation so your trend stays comparable. Also align the window with actual renewal/cancellation timing, because calculating outside renewal windows can create forced churn artifacts.
2) Write your metric dictionary before reviewing results. There is no universal churn definition, so document exactly what each metric means in your business and what counts as a loss.
| Metric | What to document | What it answers | When it should drive action |
|---|---|---|---|
| Customer churn | Who counts as a lost customer in the period | Account loss volume | When customer exits are rising, even if revenue impact looks limited |
| Revenue churn | Which recurring revenue loss counts in the period | Cashflow impact | When loss is concentrated in higher-value accounts |
| Gross churn | What you include as pure loss before any offsets | Baseline leakage view | When you need the unoffset loss picture for retention planning |
| Net churn | Which offsets are allowed and how they are applied | Post-offset direction | Only after offset rules are written and applied consistently |
If you cannot explain each label in one sentence, stop and finalize definitions first.
3) Prepare the minimum dataset and governance rules. At minimum, prepare beginning-of-period and end-of-period customer counts, plus the list of lost customers for the same period. For operational consistency, keep one working source for the cycle, use one period-label format, and keep segment tags explicit and stable so comparisons do not drift between runs.
4) Add segment economics and conditional cross-border metadata. Before running formulas, review CLV and CAC by segment so you prioritize intervention where retention loss and acquisition cost hurt most. If billing or payouts cross borders, add only the metadata needed to keep records interpretable (for example: billing country, invoicing location used, currency, payout destination, and a jurisdiction_check_status value such as verified or pending based on your internal requirements).
Readiness gate: pass only if you can reproduce the same churn output from the same inputs. If you cannot, fix setup first. If your KPI baseline is still messy, clean it up with How to Set and Track KPIs for Your Freelance Business.
How do you set the right churn scope and timeframe?#
Set scope before any calculation or review meeting: lock one reporting window and one loss definition, then keep both fixed until you formally change the metric.
Step 1 Choose one default reporting interval and document the reason. Pick your primary cadence based on contract or renewal pattern, billing cycle, and decision cadence. Use the interval that matches when a customer can realistically discontinue, then record it as the default so results stay comparable cycle to cycle.
Step 2 Write one canonical scope statement and use it every cycle. Keep it short and repeatable:
"Churn for this report means customers active at the start of the verified reporting period who are counted as lost when the verified loss event occurs during that period. Current exclusion list pending business verification. Current reactivation and upgrade treatment pending business verification."
Do not publish churn until all unresolved fields are confirmed. The required parts are start population, loss event, exclusions, and reactivation/upgrade treatment.
Step 3 Decide which churn lens triggers action. Track customer churn and revenue churn together, then escalate to segment-level review when they disagree.
| Decision question | Primary lens | Act first on |
|---|---|---|
| Are too many accounts leaving? | Customer churn | Segment-level account loss patterns, even if revenue impact looks small |
| Is recurring income dropping faster than account count? | Revenue churn | High-value account loss, contraction patterns, and revenue concentration risk |
| Do account and revenue signals conflict? | Both, then cohort view | Segment-level diagnosis before choosing interventions |
When signals conflict, use cohort analysis before acting: acquisition cohorts help with timeframe-based tracking, and behavioral cohorts help diagnose why users leave.
Step 4 Freeze boundary-case rules before you share results. Write one verified rule for each common edge case:
- Pause or temporary suspension:
Current classification rule pending business verification - Downgrade or contraction:
Current contraction treatment pending business verification - Mid-period plan change:
Current plan-change rule pending business verification - Failed collection or dunning outcome:
Current dunning-loss rule pending business verification - Voluntary vs involuntary churn:
Current churn-type classification pending business verification
If reviewers cannot tell what is in or out of churn from this written scope, stop and fix scope before calculation.
Calculate churn correctly and make the result decision-ready#
Keep one fixed calculation sequence every cycle so your churn output stays comparable and practical.
Step 1: Map inputs before you run any math. Use one written checklist first, because churn is calculated in many different ways and method drift breaks decisions.
- Start-of-period customer base
- Approved loss events in that same period
- Recurring revenue field used for loss measurement
- Documented treatment of expansion and reactivation
Verification point: sample lost accounts and confirm each one was active at the start of the period and matches your loss rule. Watch for common distortions like accidentally counting trial users or mishandling seasonal or episodic users.
Step 2: Calculate in one fixed order.
- Customer churn rate: (customers lost ÷ customers at start) x 100
- Revenue churn: same period, using recurring revenue tied to that start-period base
- Gross churn: recurring revenue lost before offsets
- Net churn: result after documented expansion or reactivation offsets
| Metric | Action trigger | Owner | Likely misread |
|---|---|---|---|
| Customer churn | Account loss exceeds current account-loss threshold pending business verification | Retention or customer success lead | Assuming account count alone explains cash impact |
| Revenue churn | Recurring revenue loss exceeds current recurring-revenue threshold pending business verification | Finance owner | Missing concentration risk in larger accounts |
| Gross churn | Gross leakage rises versus prior cycle | Finance + retention | Assuming expansion fully cancels loss |
| Net churn | Net result improves while gross still elevated | Revenue leader | Treating net improvement as full retention recovery |
Compact scenario: you lose one larger account but expand several smaller ones. Net churn can improve while gross churn still shows meaningful leakage, so present both views together.
Step 3: Gate actions with economics, then QA the output. Do not pick interventions until churn movement is reviewed with CLV, CAC, segment economics, and your retention cost assumptions. Before sharing results, run this QA block:
- Reconciliation check: tie reported losses back to source records
- Reproducibility check: rerun the same period and confirm the same result
- Exception log: record overrides, exclusions, and late status changes with reason and owner
You might also find this useful: How to Calculate Customer Acquisition Cost (CAC).
What does high churn mean for your cashflow system?#
High churn is an immediate cashflow control issue, not just a reporting issue. If churn rises faster than growth, you can lose recurring revenue momentum and planning confidence in the same cycle.
Step 1: Triage the signal before you react. Use your locked reporting window (month, quarter, or year), then classify what moved. Customer-count loss and revenue-value loss can point to different failures, so review both before choosing a fix.
| Signal | Likely root cause | First containment action |
|---|---|---|
| Customer churn rises, revenue churn stays muted | Smaller-account exits, onboarding friction, weak early value | Review cancellation timing and first-value milestones |
| Revenue churn rises faster than customer churn | Large-account loss or downgrades | Build an at-risk account shortlist and contact high-value accounts first |
| Churn follows failed collections or payment failures | Payment-operations issue, not product-value failure | Audit dunning, retries, invoice status, and recovery steps |
| Gross churn worsens while net looks stable | Expansion is masking leakage | Pause celebration and inspect lost-revenue accounts directly |
Verification artifact for each spike: a shortlist of at-risk or lost accounts, stated reason, and next experiment. Without that diagnostic step, teams often guess and over-invest in the wrong fix.
Step 2: Run a weekly diagnosis loop. Split voluntary and involuntary churn first. Then separate product-value issues from payment-operations failures, and account loss from revenue loss. If customer churn is flat but revenue churn worsens alongside payment failures on larger accounts, fix payment reliability before changing onboarding or pricing.
Step 3: Escalate spikes with one owner. When churn breaks your trigger criteria (current threshold pending business verification), assign:
- owner
- working hypothesis
- corrective action for this week
- review checkpoint for next week
Pass if every spike has an accountable owner and a documented next action. Fail if the team can describe the trend but cannot name who is fixing what now. This pairs well with our guide on How to Set Sales Quotas for a SaaS Team.
Turn churn monitoring into a reusable get-paid playbook#
Make churn review a fixed operating loop, not a one-off analysis. Each cycle, separate retention risk from payment-ops risk, prioritize accounts with the biggest cashflow impact, and assign one owner with one due date for each action.
If you run monthly, use this loop monthly. If you run quarterly, keep the same loop and change only the window. Consistency is the control: when definitions, fields, or handoffs keep moving, your churn number stops supporting decisions in day-to-day business terms.
Run the cycle in the same order every time#
Step 1. Unify inputs before diagnosis. Start from one locked view that combines churn outputs with your operating fields: invoice state, payout status, collections exceptions, renewal timing, segment, account value, and stated cancellation or downgrade reason. If you use dashboards or health scoring, keep the underlying account-level records visible.
Verification point: You should be able to trace every at-risk or lost account from the headline metric to its latest billing, payment, or renewal event. If you cannot, fix the data model and handoffs before debating causes.
Step 2. Reconcile payment operations before labeling a retention issue. Check whether payment exceptions line up with churn movement first. If they do, route those cases into a payment-ops lane before proposing onboarding, product, or pricing fixes.
| Risk lane | Signal pattern | What it implies | First action |
|---|---|---|---|
| Retention risk | Cancellations cluster near renewal while payment records are clean | Value, onboarding, fit, or pricing issue | Review cancellation reasons and contact highest-value upcoming renewals first |
| Retention risk | Customer churn rises while revenue loss stays muted | Smaller-account exits are driving account loss | Review early-value milestones and onboarding friction before pricing changes |
| Payment-ops risk | Collections exceptions or overdue invoice patterns rise before churn | Recovery workflow is likely contributing to loss | Review retry logic, invoice follow-up, and exception handling first |
| Payment-ops risk | Revenue churn worsens around payout issues or failed collections on larger accounts | Cashflow exposure is concentrated in high-value accounts | Prioritize affected high-value accounts and clear payment blocks before product changes |
Leave this step with two clear queues, not one mixed backlog.
Step 3. Prioritize by near-term cashflow impact. Work highest-value renewals, large downgrades, and near-term billing events first. Then handle lower-value loss patterns. This keeps response order aligned to cashflow risk, not just account count movement.
Short scenario: if account-count churn is flat but revenue churn jumps and large renewals also show collections exceptions, fix payment recovery first. If payments are clean and newer accounts still cancel early, prioritize onboarding or product intervention first.
Step 4. Assign owner, due date, and handoff for every action. For each flagged account or segment, log owner, next action, due date, and escalation path if the first action fails. Use journeys, tasks, and alerts to enforce follow-through, not just to notify.
Verification point: Every item ends the cycle with a named owner and next review date. If ownership is unclear, the loop is not ready for the next cycle.
Set policy gates and keep records#
Step 5. Define governance roles in plain terms. Name who owns communication permissions, consent/preference handling, and audit-trail records. Separately, name who owns merchant-side operational checks such as refunds, dispute handling, and payment exceptions. If you use a payment partner or Merchant of Record, document what they handle and what your team still owns.
| Area | What to document |
|---|---|
| Communication permissions | Name who owns communication permissions, consent/preference handling, and audit-trail records. |
| Merchant-side operational checks | Name who owns refunds, dispute handling, and payment exceptions. |
| Payment partner or Merchant of Record | Document what they handle and what your team still owns. |
Keep a compact evidence pack each cycle:
- locked input export
- payment and collections exception log
- ranked at-risk account list
- owner, action, due date, and handoff log
- outreach and approval record, including consent/preference checks and final outcomes
This is what makes churn monitoring reusable, defensible, and decision-ready each cycle. Need the full breakdown? Read How to Calculate Cap Rate for a Rental Property.
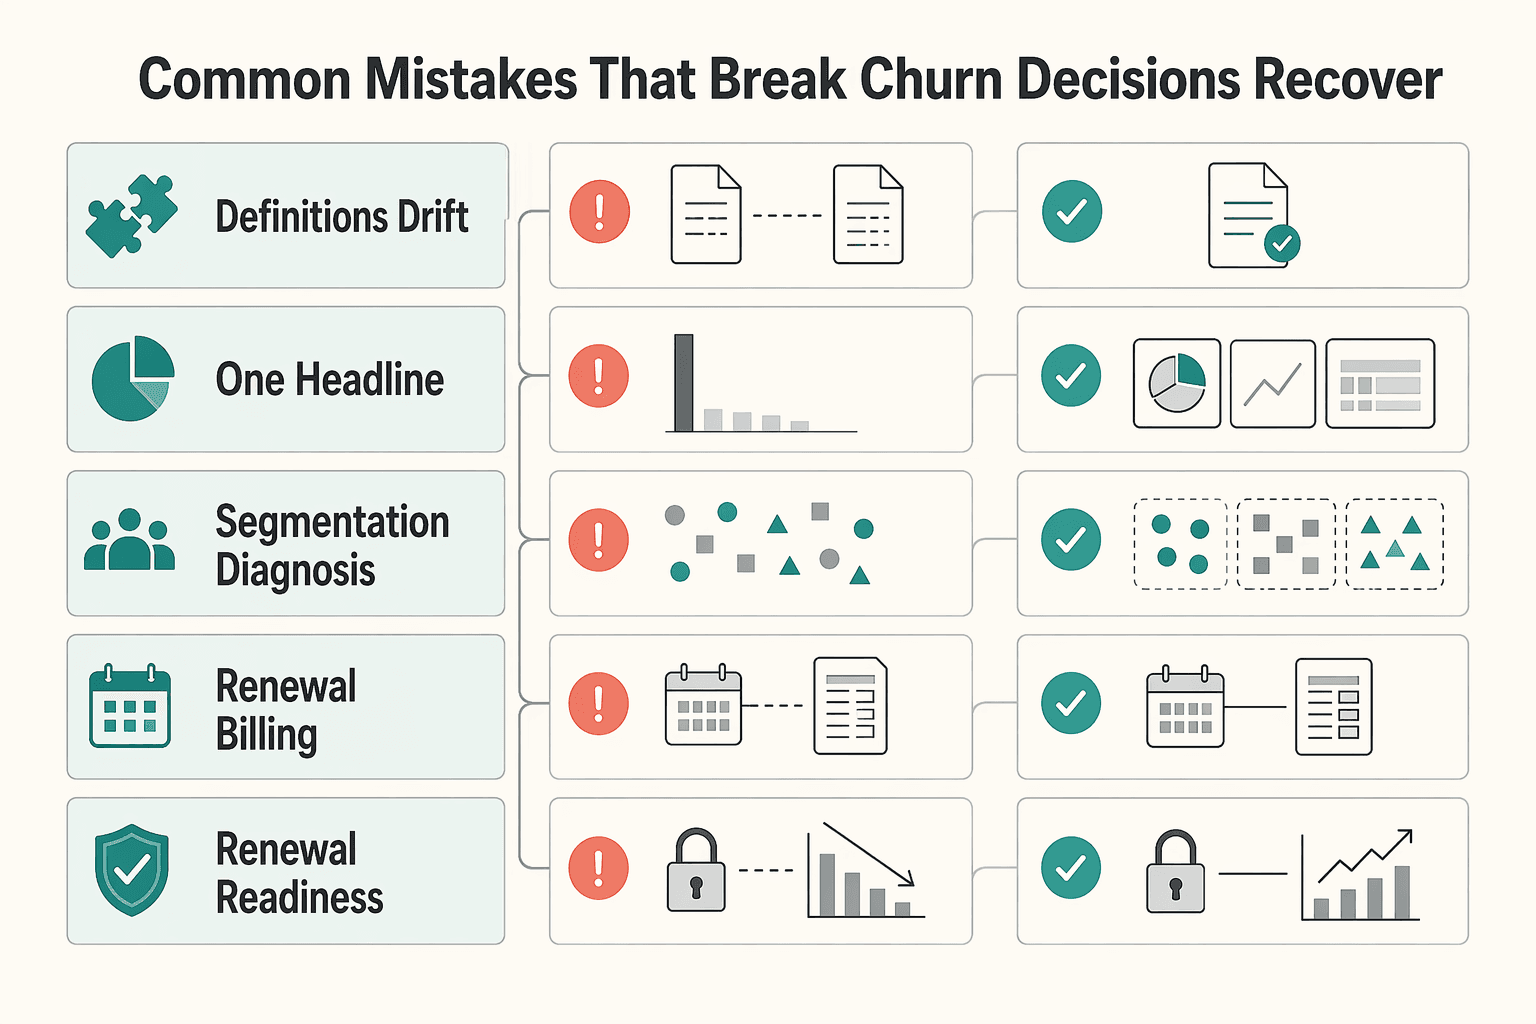
Common mistakes that break churn decisions and how to recover#
Most churn mistakes come from process drift, not math. If definitions, time windows, or ownership are inconsistent, fix those first or your churn actions will be misdirected.
Use this as an operating decision table, not a theory list.
| Mistake | Operational signal | Likely root cause | Immediate recovery action | Owner |
|---|---|---|---|---|
| Definitions drift across teams | Finance, product, and growth show different churn results for the same period | Customer churn, revenue churn, CLV, and CAC are documented in different places or updated informally | Publish one shared metric dictionary and lock one cadence (monthly, quarterly, or yearly) for comparisons | Finance lead or analytics owner |
| One headline number drives every action | Customer churn looks stable while cash or margin pressure worsens | Account loss is reviewed without revenue impact or acquisition-cost context | Review customer churn with revenue impact, CLV, and CAC before selecting interventions | Finance lead with growth owner |
| No segmentation in diagnosis | Broad fixes launch, but losses keep repeating in the same subset | Voluntary and involuntary churn, revenue tiers, or behavior groups are blended | Segment review by revenue, behavior, and churn type before assigning work | Retention or operations lead |
| Renewal and billing friction is treated as product churn | Losses cluster around billing events, failed collections, or overdue invoices | Payment and renewal operations are breaking continuity before value is re-evaluated | Audit billing exceptions, retry flow, renewal notices, and invoice follow-up first | Finance or billing operations owner |
| Renewal readiness checks are incomplete | Renewals stall while records are corrected | Required customer, tax, permission, or renewal data is missing from pre-renewal workflow | Add a renewal-readiness checklist and policy notes for current threshold and deadline fields pending business verification | Operations owner with finance review |
Step 1: Lock one churn dictionary before diagnosis. Keep one shared definition set for customer churn, revenue churn, CLV, and CAC. Assign one change owner, and make every dashboard reference that source so definition drift cannot silently reappear.
Step 2: Keep one reporting window per decision cycle. Pick one cadence (monthly, quarterly, or yearly) and compare like with like. If you mix windows, you are not seeing trend; you are seeing noise.
Step 3: Add economic context before choosing fixes. A stable customer churn rate can still hide worsening outcomes if higher-value accounts are leaving or replacement costs are rising. Pair churn review with CLV and CAC so retention decisions reflect margin risk, not just account count.
Step 4: Route by churn type, not by assumption. If losses track billing events, start in payment and renewal operations. If payments are clean and exits point to fit, service, or pricing, route to retention and product.
Step 5: Keep compliance and renewal checks operational. Do not debate jurisdiction specifics in the churn meeting. Keep threshold and deadline fields in local policy notes, marked pending business verification until confirmed during each cycle.
A short scenario: customer churn stays flat, but revenue churn jumps in one cycle. The first read blames pricing; segmented review shows concentration in involuntary churn tied to billing exceptions and incomplete renewal records. The team fixes those process gaps first, and the next cycle is more predictable because the decision was based on correct routing, not a headline guess.
Before closing the cycle, verify:
- one shared dictionary is active for customer churn, revenue churn, CLV, and CAC
- all comparisons use one fixed window only (monthly, quarterly, or yearly)
- losses are segmented by revenue, behavior, and voluntary vs involuntary churn
- each billing, renewal, or compliance exception has a named owner and due date
- at least one documented process fix changed the decision and improved payment predictability
Related: How to Find and Secure Public Speaking Gigs as a Freelancer.
Build your churn control loop and execute it every cycle#
Run the same four-step loop every cycle: measure, diagnose, act, and re-measure. That is what turns churn from a report into a control system.
- Step 1. Lock one method and keep it fixed.
Pick one reporting window, then keep it fixed. Calculate customer churn the same way each cycle: customers lost during the period / customers at the start of the period x 100. Track customer churn and revenue churn separately because they show different views of business health, and document your revenue-churn method so it does not shift midstream.
Verification: rerun one closed period later. If customer churn changes, your period boundaries, start base, or exclusion rules are not stable yet.
- Step 2. Add value context before you choose what to fix.
Do not use churn alone to decide actions. Review churn with LTV and CAC so you can see account loss, value loss, and acquisition efficiency together.
| Metric | What it signals | What it can mask | First action |
|---|---|---|---|
| Customer churn | How many accounts left in the period | Revenue impact when higher-value accounts leave | Segment losses by cohort, plan, or channel |
| Revenue churn | How much recurring value left | Whether account count changes match value loss | Review lost revenue by customer tier and renewal month |
| LTV | Customer value over time in profitability terms | Near-term acquisition pressure | Prioritize retention work for high-value segments |
| CAC | Cost to acquire customers | Whether acquired customers stay long enough | Check if high-churn channels are also high-cost channels |
- Step 3. Diagnose one cause at a time and assign one owner.
Use evidence, not guesswork. Check customer data, cohort analysis, and direct feedback such as surveys and reviews. For the next cycle, document one owner, one testable cause hypothesis, and one intervention so the follow-up is clear.
- Step 4. Re-measure and keep an audit trail.
In the next cycle, review the same segment with the same method. Log inputs, hypothesis, action, owner, and outcome. If your response touches billing controls, account restrictions, or regulated onboarding, keep the compliance fields in the same log with current thresholds marked pending business verification until confirmed.
Use this cycle checklist each time:
- Fixed period and fixed start-of-period base confirmed
- Customer churn and revenue churn tracked separately
- LTV and CAC reviewed before action
- One owner, one cause hypothesis, one intervention assigned
- Next-cycle follow-up check scheduled
- Inputs, decisions, and compliance notes logged for audit
Related reading: How to Calculate Cash-on-Cash Return for Real Estate.
Frequently Asked Questions
How do you calculate churn rate?
Fix one specific period first, such as a month or quarter. Count customers at the start of that period, count the customers lost during it, then divide lost customers by starting customers and multiply by 100. If your inputs stay the same, recalculating that same period later should return the same percentage.
What rules keep the number consistent?
Keep your period boundaries strict and your inputs stable every time you run the report. If one team uses customers at the start of the period and another uses a different base, stop and reconcile before you compare trends. A common failure is mixing definitions or windows and treating the difference as real movement.
Should you measure churn monthly, quarterly, or annually?
Track churn continuously, but set your analysis cadence based on your organization and the decisions you need to make. Teams can review churn annually, quarterly, monthly, weekly, or even daily, as long as the period definition stays consistent.
What is the difference between customer churn and revenue churn?
Customer churn tells you how many accounts you lost. Revenue churn tells you how much recurring value left, which matters when higher-value subscribers are the ones exiting. Review both, because count loss can look manageable while revenue impact is getting worse.
What should you do after you calculate a high churn rate?
Treat it as a financial risk signal, not just a bad headline. After calculating churn, analyze it further to determine likely causes and develop retention strategies. Review customer churn and revenue churn together before you act, then check the next cycle to confirm whether the trend is improving.
Try a related tool
Researched and edited by the Gruv editorial team. Gruv builds cross-border billing, payouts, and finance-operations software for global businesses.
Sources
Includes 3 external sources outside the trusted-domain allowlist.
- hbs.edu/ris/download.aspxtrusted
- leg.colorado.gov/initiative_files/3308/downloadtrusted
- marketing.wharton.upenn.edu/wp-content/uploads/2016/10/comprisk1.pdftrusted
- pmc.ncbi.nlm.nih.gov/articles/PMC12074543trusted
- stripe.com/resources/more/how-to-build-a-customer-churn...trusted
- alexandergroup.com/insights/10-rules-for-calculating-churnexternal
- amplitude.com/blog/churn-rate-formulaexternal
- appcues.com/blog/cohort-analysisexternal
Educational content only. Not legal, tax, or financial advice.
Related Posts

Digital Nomad Health Insurance Comparison for Long-Stay Moves
Use focused time now to avoid expensive mistakes later. Start with a practical `digital nomad health insurance comparison`, then map your route in [Gruv's visa planner](/tools/visa-for-digital-nomads) so we anchor policy checks to your real plan before pricing pages pull you off course.

How to Set and Track KPIs for Your Freelance Business
Better decisions matter more than more metrics. The practical goal is to finish each review knowing what to change next, who owns that change, and when you will verify whether it worked.

How to Find and Secure Public Speaking Gigs as a Freelancer
---