
Quick Answer
Set clear save rules before model tuning: define churn states (trial, active, paused, churned), lock the evidence pack (usage, support, billing, cancellation reasons), and route interventions by value tier. Then require each high-risk flag to show top drivers, confidence band, and action owner before a team spends money. Validate impact with ARR, NRR, and CAC outcomes, not model accuracy alone, so high-touch rescue goes to subscribers where retained value justifies the effort.
How Churn Prediction Helps Platforms Act Before Cancellation#
A churn score matters only if it changes what you do before a subscriber leaves. If the output lives in a dashboard and never affects pricing, outreach, feature access, or support treatment, you do not have a retention motion. You have a reporting artifact.
Churn prediction software is generally used to identify customers likely to leave. Vendors like Gainsight frame AI as a way to predict churn risk and act before customers leave, and Zendesk's framing highlights something many teams miss: useful prediction is not built on product usage alone. Support interactions, sentiment, satisfaction, and other customer experience signals can surface risk that a simple login decline may miss.
If you came here looking for an ai churn prediction at-risk subscribers platform guide, keep one test in mind from the start. Can your team connect a risk flag to a monetization decision that protects margin, not just retention optics? That requires founders, revenue leaders, product teams, and finance operators to agree on what is worth saving, when to intervene, and how much rescue effort a subscriber can justify.
- Prepare the evidence pack
Get your subscription lifecycle states, usage events, support history, and cancellation reasons into a form teams can trust.
- Score risk in a way people can challenge
Use signals that are visible and explainable enough for operators to spot false positives, timing issues, and missing data.
- Tie intervention to value and timing
A high-risk, high-value active subscriber should not get the same treatment as a low-value account already sliding toward cancel.
- Verify business impact with finance metrics
Check whether the motion improves ARR, NRR, and CAC, not just whether the model can separate risky from stable accounts.
Those finance terms matter because they keep churn work from drifting into vanity metrics. ARR is annualized recurring subscription revenue. NRR measures the recurring revenue retained from existing customers, including expansion and churn effects, over a period. CAC is the cost to acquire one additional customer. A simple checkpoint: if your post-launch review ends at model accuracy and never reaches ARR, NRR, or CAC, you are not done.
The vendor field is broad. AWS Marketplace has a dedicated churn prediction solutions category, and current software roundups include names like Pecan, Gainsight, and Zendesk. A common gap is what happens after the score appears: who owns the call, what action gets approved, which subscribers are not worth saving, and how you prove the save motion paid for itself. That operating detail is where this article stays focused.
What to prepare before you score a single subscriber#
Before you score anyone, lock the operating setup: define churn in your context, set the minimum evidence pack, assign owners, and tie action timing to subscription events.
Step 1 Define the business objective and churn meaning in one line. Aim to reduce subscriber churn while protecting net economics such as ARR, NRR, and CAC. Then document how your billing states map to the lifecycle you will score (for example, trial, active, paused, and churned) so teams can classify subscribers consistently.
Step 2 Build a minimum evidence pack before tooling decisions. Include subscription lifecycle records, product usage events, support interactions, and cancellation reasons. Keep raw lifecycle and cancellation fields intact, especially if one customer can have multiple active and inactive subscription records.
Step 3 Assign named owners for model changes, intervention approvals, and post-launch readouts. Churn work is cross-functional, so ownership should be explicit across the teams involved instead of isolated in one function.
Step 4 Set a hard decision window for action. Define pre-renewal and pre-cancel checkpoints based on how cancellation can occur in your system (immediately, period-end, or a custom date) so at-risk subscribers are contacted in time.
That prep gives you a scoring process teams can challenge and actually run. The next step is setting decision rules so interventions protect both retention and economics.
Related: What Is a Subscription Lifecycle? How Platforms Manage Trial Active Paused and Churned States.
Set the economic guardrails before model tuning#
Set the money rules first so churn work improves retention economics, not just save rates.
Step 1 Band subscribers by value before you score churn. Use your lifetime value (LTV) estimate and current Annual Recurring Revenue (ARR) contribution to sort subscribers into practical bands (for example, high, medium, and low value). The goal is not a universal cutoff, but consistent triage so high-risk, high-value subscribers are handled differently from high-risk subscribers with limited retained value.
Use this checkpoint: for any subscriber in the save queue, the team should be able to explain the LTV band, ARR at risk, and why the intervention spend is justified.
Step 2 Set a hard ceiling on intervention cost. If projected retained LTV is lower than save cost, route that subscriber to lower-cost automation instead of high-touch rescue. This helps avoid spending retention budget on low-value subscribers while higher-value subscribers are under-served.
Make total cost explicit, including discount cost, human time, service credits, and escalation effort. Avoid blanket offers like a flat 20% discount to all at-risk subscribers, since that can increase saves while pressuring margin.
Step 3 Separate model KPIs from business KPIs. Model metrics show whether the score is useful; business metrics show whether interventions improved outcomes. Track Net Revenue Retention (NRR), Gross Revenue Retention (GRR), ARR preserved, and CAC payback impact as a separate layer from model-quality metrics.
Document the KPI logic in advance: NRR includes expansion and churn effects, while GRR excludes expansion so baseline retention is visible.
Step 4 Write down the explicit "do not optimize" traps. Include saving unprofitable cohorts to lift vanity retention, over-discounting low-value segments, and reading expansion-led NRR gains as proof that save strategy improved.
Keep this output short and operational: value bands, cost ceilings, KPI split, and do-not-optimize rules agreed before tuning starts.
Build a risk score that teams can trust and explain#
A risk score is only useful if operators can explain why a subscriber was flagged and when to act. If they cannot, trust falls and false positives consume the queue.
Step 1 Combine signals from different failure patterns, not just usage decline. Use a mix of activity frequency, feature usage, session recency, support tickets, billing events, and feedback signals. Keep the signal set scannable by grouping into behavior decline, support friction, sentiment shift, and engagement drop-off across subscription lifecycle transitions. If trial, active, and paused states behave differently, score them with stage-aware logic instead of forcing one global threshold.
Step 2 Publish a transparent scoring schema with confidence bands. The score should rank subscribers from low to high risk, and the predicted probability should be treated as a confidence signal that is checked for calibration. Put the score, confidence band, and top contributing features on the account record so Customer Success can challenge questionable flags. Keep the tradeoff explicit: lower thresholds can catch more potential churners, but precision falls and false positives rise.
Use a simple operating rule: if the output cannot answer "what changed?" in one sentence, do not let it trigger high-touch intervention by itself. Route it to review first.
Step 3 Add timing, not just likelihood. When possible, include survival analysis or equivalent time-to-event logic so teams can estimate when risk is likely to convert, not only whether churn may happen. This is especially useful in short action windows like pre-renewal, pause-to-churn transitions, and billing-triggered risk. If time-to-event modeling is not available yet, separate near-term and longer-term risk outputs and label that limitation clearly.
Step 4 Maintain a verification table and a short model card next to the score. The model card should state intended use, evaluation procedure, threshold choices, and known weak segments. Where data quality is weak, mark it clearly instead of implying certainty.
| Signal source | Update frequency | Known blind spots | Owner |
|---|---|---|---|
| Product activity and feature usage | Record actual cadence (some teams update daily) | Shared logins, tracking gaps, seasonal usage swings | Product or Data |
| Support tickets and complaint volume | Record actual cadence from the support tool | Silent frustration that never becomes a ticket | Support Ops |
| Billing events and payment failures | Record actual cadence from billing syncs | Grace periods, delayed posting, manual write-offs | Finance Ops |
| Feedback scores and sentiment text | Record actual cadence and collection method | Low response volume, loud minority bias | Account team |
Verification check: for each high-risk record, show last refresh time, top drivers, and source owner. A common failure mode is adding more signals without pruning noisy ones, which makes the system look more advanced while trust gets worse.
If you want a deeper dive, read Streaming Platform Churn Analysis: Why Subscribers Leave OTT Services and How to Win Them Back.
Map interventions to risk tier, lifecycle stage, and value#
A churn score creates value only when it routes each subscriber to the right default action based on risk, value, and lifecycle state.
Build one intervention matrix before outreach starts. Fill every cell, even when the default is "no intervention."
| Lifecycle state | High risk + high value default | Medium risk + low value default | Stop or escalate rule |
|---|---|---|---|
| Trial | Human onboarding outreach when friction is visible; fix setup blockers fast | In-product nudges, onboarding checklist, low-cost automated offer | Stop incentives after one offer unless the segment is strategically important |
| Active | Human outreach tied to top risk driver; consider plan or support change | Product education, usage prompts, or automated retention offer | No repeat discount without manager or Finance approval |
| Paused | Reason-based check-in and clear resume path | Low-cost reminder sequence only | After the planned touch limit, move to passive monitoring |
| Churned | Targeted win-back campaign for high-value, winnable former subscribers | Suppress broad win-back blasts | Re-enter only on a real reactivation signal |
Use explicit if-then rules so Product, Revenue, and Finance make the same decision on the same account. Example: high risk + high value + active gets human outreach inside the action window; medium risk + low value gets automated nudges or offers; high risk + low value may get no rescue motion if CLV economics do not justify it.
Tie each intervention to a monetization lever, not just a message. Choose between pricing or packaging changes, feature-access changes, support SLA changes, or targeted win-back campaigns based on the likely churn driver.
For churned subscribers, prioritize high-value, winnable users instead of blasting all canceled accounts. This matters more when acquisition slows: Recurly reports acquisition rates fell from 4.1% to 2.8% from 2021 to 2024, and says 20% of new acquisitions come from returning subscribers. For post-cancel execution detail, see Win-Back Campaigns for Platform Operators: How to Re-Engage Churned Subscribers Automatically.
Set stop conditions before discounting starts. Define how many save attempts are allowed, who can approve concessions, and when an account moves from rescue to churned or win-back status. Discounts can be a last resort, but repeated concessions without hard limits can erode margin and weaken unit economics.
Launch in 30 days with weekly checkpoints#
A 30-day launch can tell you whether your churn model is operationally useful, but only if the first month stays controlled and decision-focused.
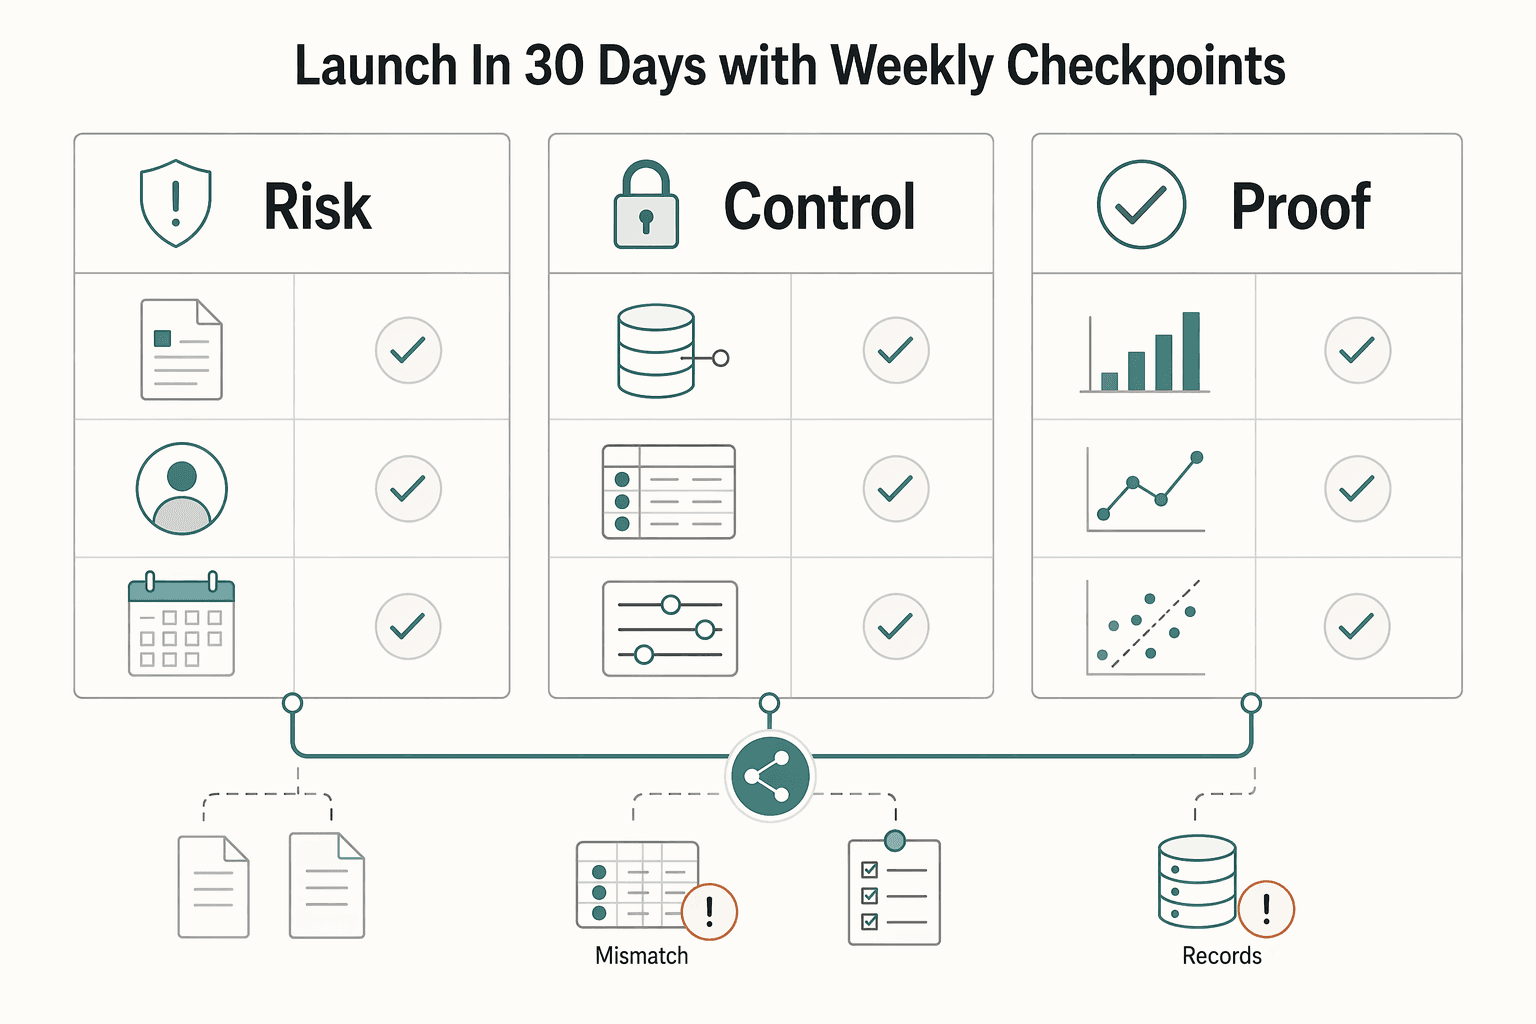
| Week | Focus | Key checkpoints |
|---|---|---|
| Week 1 | Lock scope, ownership, and measurement | Finalize the data contract, named owners, and KPI definitions; freeze the initial cohort and baseline churn; confirm at least 1,000 customer profiles, preferably two to three years of subscription data, and at least two activity records for 50% of in-scope customers |
| Week 2 | Run shadow scoring only | Score live traffic in parallel while production behavior stays unchanged; compare predicted risk with observed churn signals; log false-positive patterns before any live intervention |
| Week 3 | Activate one segment with a holdout | Turn on interventions for one bounded segment your team can support; keep a holdout group on the current experience; evaluate treatment versus control while monitoring operational load |
| Week 4 | Make a hard decision and document it | Review uplift versus cost; choose scale, retrain, or rollback; publish a short decision memo with cohort scope, churn window, key false-positive themes, and ARR/NRR implications |
Week 1: lock scope, ownership, and measurement. Finalize the data contract, named owners, and KPI definitions before scoring starts. Define the churn window around your business cadence, then freeze the initial cohort and baseline churn so later results are interpretable. As a readiness check, confirm at least 1,000 customer profiles, preferably two to three years of subscription data, and at least two activity records for 50% of in-scope customers.
Week 2: run shadow scoring only. Score live traffic in parallel while production behavior stays unchanged. Use this period to compare predicted risk with observed churn signals and log false-positive patterns before any live intervention.
Week 3: activate one segment with a holdout. Turn on interventions for one bounded segment your team can support, and keep a holdout group on the current experience. This lets you evaluate treatment versus control while monitoring operational load.
Week 4: make a hard decision and document it. Review uplift versus cost, then choose one path: scale, retrain, or rollback. Publish a short decision memo with cohort scope, churn window, key false-positive themes, and ARR/NRR implications.
Choose the right platform without getting trapped by vendor demos#
Choose the platform you can audit and activate in production, not the one with the cleanest demo. Prioritize explainability, speed to first live action, and integration friction.
Build a short list around operational fit#
Use Zendesk's January 13, 2026 comparison list to build candidates (including Gainsight and Pecan), then validate operational fit yourself. Gainsight positions churn response as cross-functional work, and Pecan highlights deployment in days, so both are useful to test for different execution needs.
For each vendor, require one live walkthrough where a risk score becomes a real task, message, or case in your existing systems. If the score stays in a dashboard and your team must manually re-enter it, treat that as a real integration gap.
Require evidence you can inspect#
Before procurement, ask for a model card or equivalent documentation that includes intended use, evaluation procedure, and benchmark context. If your team cannot inspect how claims were produced, treat confidence as limited.
In your buying memo, mark unclear items as unknown:
- benchmark methodology
- subscriber-specific validation
- pricing logic
This is critical for AWS Marketplace offers where pricing may be custom to your requirements and eligibility.
Pressure-test claims before you sign#
Some AWS Marketplace churn offers cite 30, 60, or 90 day prediction horizons, and AWS also states it does not warrant vendor listing content as accurate, complete, reliable, current, or error-free. Validate claims on your own cohort and workflow before signing.
If options are close, choose the one with the clearest audit trail and easiest cross-functional adoption. That is usually more reliable than any "best of" ranking.
We covered this in detail in How to Calculate and Manage Churn for a Subscription Business.
Common mistakes that kill ROI and how to recover#
Churn ROI usually breaks in operations, not in model math. The recurring failure points are accuracy-only tuning, one-size-fits-all interventions, unclear Product-to-CS ownership, and stale signals.
Re-rank success around economics, not score performance alone#
Higher model accuracy does not guarantee better business outcomes. Churn programs are stronger when you evaluate predictive performance alongside profit and Customer Lifetime Value (CLV), then set the precision-recall tradeoff based on intervention cost.
Run one operating view that puts precision/recall next to your revenue outcomes, intervention cost, and expected retained value. If your saves are high-touch, control false positives tightly because team time and incentives are expensive. The core check is simple: by risk tier, retained value should exceed the cost of the action you take.
Stop sending the same rescue motion to every risky account#
Different account segments need different save plays. Segment by lifecycle stage and value tier first, then assign default actions by segment instead of pushing one generic intervention to every flagged account.
Validate each motion against a control cohort before broad rollout. Otherwise, you cannot separate true impact from accounts that were unlikely to churn anyway. This is where many teams over-spend on low-value segments and dilute returns.
Make ownership explicit between Product and the account team#
Siloed teams weaken early retention. When Product, Sales, Support, and CS run on different goals, response quality drops, and fragmented data makes it worse; in one cited streaming benchmark, only 13% had consolidated cross-organization data.
Set SLA-style ownership by risk tier and intervention type: who reviews, who reaches out, who approves offers, and who records outcomes. If Product owns in-product fixes and CS owns outreach, define response windows and shared evidence logging so every high-risk flag has a clear owner and disposition.
Audit signals before teams stop trusting them#
Signal quality decays unless you monitor it. Use regular false-positive/false-negative reviews and model-drift monitoring with alerts, then adjust review cadence to match volatility.
Watch for repeated noisy features, including adoption-only signals used in isolation. Improve health scoring with both quantitative and qualitative inputs, and demote or remove features that repeatedly trigger low-value false alarms until they prove value again.
Conclusion and copy-paste execution checklist#
The point is not to predict churn more elegantly. It is to keep the right subscribers in ways that improve ARR, protect NRR, and avoid spending more to save an account than the retained value justifies.
If you take one thing forward, make it this: treat retention as a shared operating decision across Product, Revenue, Finance, and Customer Success, not as another isolated dashboard. For this effort to earn trust, every score needs an owner, a reason, and an action path tied to economics.
- Define success in money terms first.
Write down the business target before you tune anything: healthier ARR, better NRR, and disciplined CAC, not a prettier churn score. Keep the finance math simple in your review memo: ARR can be reported as MRR × 12, and NRR should stay an existing-customer metric rather than being blurred with new-logo growth. Your verification point is whether the weekly readout shows both model quality and financial impact, because AUC or F1 alone can look strong while still hurting commercial outcomes.
- Confirm lifecycle states, signals, and owners.
Before live use, make sure your lifecycle map is complete enough to act on: trial, active, paused, churned, plus the key transitions where risk becomes practical. Pair each signal source with its update frequency, known blind spot, and functional owner, especially for product usage, support interactions, and cancellation reasons. A frequent risk is scoring subscribers off stale or partial inputs and then blaming the team for false alarms. If a source has weak coverage, mark it as unreliable instead of pretending the score is explainable.
- Set CLV-based save thresholds and hard cost limits.
Use Customer Lifetime Value to decide which accounts deserve human intervention and which should go to lower-cost automation. The rule is straightforward: if expected retained value is below the cost to save, do not force a high-touch rescue just to improve a vanity retention number. This is where Finance matters most, because teams can overspend on low-value saves and end up with higher retention but weaker margin.
- Launch shadow scoring before outreach.
Run the model without contacting customers first, then compare predicted risk with observed churn behavior and the stated drivers behind each score. You want to confirm not only who is high risk, but why, since unexplained scores are hard to challenge and harder to operationalize. If you have two model variants, testing them on production traffic is a strong final check before broader rollout.
- Activate a tiered intervention matrix and review it weekly during rollout.
Match action to risk tier, lifecycle stage, and value tier, then define stop conditions so teams do not keep discounting accounts that will not recover. Review false positives, retained revenue, intervention cost, and team load every week during initial rollout. If the same churn drivers keep appearing after outreach, shift effort into product or support fixes instead of sending another save campaign. Scale only the parts that improve net economics.
Related reading: Build a Cancellation Flow That Saves the Right Subscribers.
Frequently Asked Questions
What signals identify at-risk subscribers the earliest?
The earliest useful signals can appear in user behavior and support interactions before billing status changes. Look for drop-offs in product usage and friction in support chat logs or call transcripts, then combine those text signals with numeric and categorical features. Waiting for failed payments or cancellation clicks can leave you with late-stage signals.
How should we prioritize save actions by likely revenue impact?
Sort by revenue churn risk, not customer-count churn alone. Revenue churn measures MRR lost from existing customers through cancellations and downgrades, so likely downgrades on high-value accounts can outweigh several low-value cancellations. Prioritize interventions where expected retained revenue justifies the effort.
What should a team do in the first 30 days after launching churn scoring?
Start with a holdout test dataset to compare model variants. Then expose the model to a small live slice such as 1% of users while you monitor a business metric, not just score quality. During that rollout, track false positives, false negatives, and operational load before expanding further.
When should we change product or pricing instead of launching another retention campaign?
Change the offer when churn risk keeps clustering around the same friction point or downgrade path after outreach. Repeated retention campaigns can mask structural issues in packaging, support experience, or product fit, especially when revenue churn is driven by downgrades. If the same segment keeps reappearing after interventions, investigate the root cause before running another campaign.
How do we know whether a churn model is trustworthy enough to operationalize?
There is no universal metric threshold that makes a model ready. Use accuracy, precision, and recall on a holdout test dataset, and judge those against your misclassification costs. Then check whether strong overall performance is masking weak results in smaller subsets. High overall accuracy alone is not enough. You want acceptable subgroup behavior and early live evidence that the business metric moves in the right direction.
What is still unknown in current vendor claims and benchmark comparisons?
Treat any benchmark as incomplete until the vendor shows the prediction window, target definition, and validation method. A 15D, 30D, or 45D rolling window can change results materially, and comparisons are weak when methodology is undisclosed. Ask whether the claim is about customer churn rate, revenue churn, or both, and ask how those results were validated in operations.
Try a related tool
Researched and edited by the Gruv editorial team. Gruv builds cross-border billing, payouts, and finance-operations software for global businesses.
Sources
Includes 7 external sources outside the trusted-domain allowlist.
- docs.stripe.com/api/subscriptions/objecttrusted
- amplitude.com/explore/analytics/churn-predictionexternal
- amplitude.com/blog/churn-predictionexternal
- arxiv.org/abs/1810.03993external
- aws.amazon.com/blogs/machine-learning/build-tune-and-deploy...external
- aws.amazon.com/marketplace/solutions/telecom/churn-predictionexternal
- cacm.acm.org/research/datasheets-for-datasetsexternal
- corporatefinanceinstitute.com/resources/valuation/annual-recurring-revenue...external
Educational content only. Not legal, tax, or financial advice.
Related Posts

Win-Back Campaigns That Reactivate Churned Subscribers Without Margin Loss
Assume from the start that a win-back flow can lift reactivations and still be a bad trade. If you do not measure what those returns cost in incentives and short-term re-churn, you can end up celebrating activity that does not help the business.

Streaming Platform Churn Analysis: Why Subscribers Leave OTT Services and How to Win Them Back
If you are doing **streaming platform churn analysis OTT**, your first move is not a discount or a copy of whatever a major platform just tried. First separate temporary churn from structural churn, then choose the retention lever that fits the exit pattern before you scale into another market.

What Is a Subscription Lifecycle? How Platforms Manage Trial Active Paused and Churned States
Subscription lifecycle states matter only when they tell your team what happens next. In **subscription lifecycle states platform management**, a label like `Active` or `Suspended` should tell finance, billing ops, and product what changes in charges, access, edits, and reconciliation.