
Quick Answer
Start with a narrow release: pick 5-7 action-driving KPIs, instrument both lag paths, and set explicit freshness targets per use case. Keep scheduled computation for numbers that still matter after a publish window, and use continuous processing only where delay changes response quality. Before expanding scope, pass replay tests, reconciliation checks, and stale-data alert routing so operators can trust what they see.
Building a real-time payment analytics dashboard is usually a phased rollout, not a single low-latency push#
Building a real-time payment analytics dashboard is usually a phased rollout, not a single low-latency push. This guide helps you make early architecture decisions around event intake, computation, integration order, and verification so you do not have to rewrite core logic once the dashboard becomes operationally critical.
For CTOs and engineering leads, the tension is straightforward. Stripe describes traditional batch subscription updates with a 24-hour average lag and notes that teams need to spot behavior patterns as they emerge. But lower latency does not make streaming the right default for every metric or team.
This guide focuses on the parts that make metrics decision-grade:
- the metrics architecture under the dashboard
- the computation logic that turns events into business numbers
- the order for integrating sources and services
- the controls that verify payment-flow, subscription, and payout metrics
A useful dashboard is more than a page that refreshes. Sage defines a real-time dashboard as a dynamic interface that updates live and describes it as a structured pipeline with data integration and processing. In payments, freshness matters most when you can trace each metric to source events and reconcile results when records are corrected.
The operating principle is simple: prioritize traceability and correctness first, then reduce latency where it materially improves decisions. Stripe's real-time analytics write-up reinforces that tradeoff by pairing end-to-end event-driven design with accurate historical reporting as the business changes. That is the design problem this article solves: deciding where low latency should drive immediate action, and where slower, reconciled computation is the better choice.
Define real time before you design anything#
Treat "real time" as an operating contract, not a label. Your dashboard should make event-to-insight lag visible so teams can tell when a metric is fresh enough to act on.
"Live" and "real time" are not always the same thing. A dashboard can refresh every 10 seconds while the underlying metric is still delayed by ingestion or processing. The core question is latency: how long after an event occurs a user or system gets a usable signal.
Set freshness targets by decision type. Metrics used for immediate operational response usually need tighter lag. Batch-oriented reporting can work with more delay, but that tradeoff means staler insights and slower reaction.
Make lag measurable in two places:
- Source-to-ingestion lag: from event time to accepted time in your system.
- Ingestion-to-metric lag: from accepted event to updated metric in the serving layer or UI.
Instrument both paths. Event records should include a timestamp and event type, and each tile should expose when its metric was last updated. If you cannot show lag by source path and by metric, treat "real time" as a target to validate, not an assumption.
For use-case selection, see Real-Time Payment Use Cases for Gig Platforms: When Instant Actually Matters.
Pick first-wave metrics that change decisions this week#
The first release should be narrow. Start with 5-7 KPIs that your team can act on this week. On this dashboard, each metric should answer not only what changed, but what you should do next.
| Metric group | Examples mentioned | Why it belongs in v1 |
|---|---|---|
| Operational signals | approval and decline rates; settlement data; processor performance signals | Closest to day-to-day operational decisions |
| Subscription health | longer-horizon business metrics | Only when they drive current product or pricing decisions |
| Compact cash view | money in and money out | Supports liquidity monitoring without bloating v1 |
This keeps you out of a common payment-analytics trap: showing outcomes without clarifying causes or next actions. If a metric moves but no one can decide whether to adjust routing, review provider performance, check fraud filters, or investigate customer behavior, it is not a strong v1 metric.
Start with operational signals that trigger intervention#
Prioritize payment-path signals such as approval and decline rates, settlement data, and processor performance signals. These are closest to day-to-day operational decisions.
Make them diagnostic, not just descriptive. Spreedly's point that payment analytics is not the whole story is useful here: processor performance is most useful when you segment it by processor, geography, or customer segment so teams can isolate where the change is happening.
Add subscription health only when it changes near-term decisions#
Longer-horizon business metrics belong here only when they drive current product or pricing decisions. If they are reviewed on a slower cadence, they can wait for a later phase.
Use a simple filter: if a metric moved last period, can the team point to a concrete action it changed? If not, defer it.
Keep Finance aligned with a compact cash view#
Keep finance coverage compact and reconciled: money in and money out. A focused cash-flow view supports liquidity monitoring without bloating v1.
If Ops and Finance ownership is unclear, treat that as a signal to clarify the metric definition and response owner quickly.
For a step-by-step walkthrough, see Payment Infrastructure Trends 2026: How Marketplace Operators Should Prioritize Real-Time Rails, Stablecoins, BNPL, and Embedded Checkout.
Standardize your event and ledger contracts#
Lock the event and ledger contract before you build dashboard tiles so your metrics stay defensible under retries and corrections.
Define your internal event model first#
Define one internal event model for normalized events, and treat your naming as the contract rather than a universal standard.
| Required field | Article detail |
|---|---|
| stable event ID | Required for each normalized event |
| idempotency key | Required for each normalized event |
| outcome state | Including settlement or failure |
| correction link | To any amended event |
Make deduplication non-negotiable#
Deduplication should be a contract rule, not a best effort during ingestion. Require a stable ID and idempotency key before any metric movement or ledger write, including retries.
Preserve an auditable path to the ledger#
For each transaction, keep a traceable chain from inbound event to normalized event to ledger posting to metric output. Save processing decisions with inputs and outputs, and retain both settlement and failure outcomes in the durable ledger.
Design for late data and corrections up front#
Model late arrivals and correction events explicitly, link them to the original event, and post adjustments for late data. When computation logic changes, version metric definitions instead of rewriting old ones in place. Use retry with backoff for transient failures, and route rejects to a dead-letter queue so failures stay visible and recoverable.
Choose batch or streaming with explicit thresholds#
Choose based on freshness decay, not tooling preference. If a metric loses usefulness within one operations cycle, prioritize streaming for that metric. If decisions can wait for a scheduled publish checkpoint, keep Batch Processing in the first release.
That keeps you from forcing every tile into the same freshness target. The batch-versus-stream choice changes latency, correctness, reliability, scalability, and operational ownership. It is less a tooling debate than a trust and operating-model decision.
| Dimension | Batch Processing | Event-Driven Pipeline |
|---|---|---|
| Latency | Processes bounded data collected over a time window as a discrete job. Best when the metric still matters after the window closes. | Continuously handles unbounded event flow. Best when delayed visibility reduces your ability to act. |
| Operating model | Validation and publish checkpoints are explicit because outputs are versioned and released after execution completes. | Ongoing operation is continuous because state, ordering, and failure recovery must be handled at all times. |
| Failure isolation | Failures are often bounded to a job run or window, and outputs can be versioned, validated, and published after execution completes. | Failures can affect a live feed until recovery, especially when ordering or state handling breaks. |
| Replay complexity | Reprocessing is often simpler with bounded datasets and post-run publish checkpoints. | Reprocessing is harder when state, ordering, and recovery are continuous concerns. |
| Team skill requirements | Better fit when your team is strong in scheduled jobs, validation, and reconciliation. | Better fit when your team can own continuous recovery and data-trust controls for live metrics. |
Use freshness decay, not instinct#
Pressure-test each metric by asking what happens if it arrives late. A fraud signal detected in 200 milliseconds can prevent loss. The same signal detected 6 hours later is often more useful for reporting than prevention. The same pattern applies broadly: some operational signals lose value quickly, while periodic reporting often does not.
So make the first release intentionally uneven. Stream metrics that change immediate action, and keep slower, reconciled reporting in batch until there is a clear reason to tighten latency. The practical question is not which pattern is better in general, but what your decision actually needs.
Hybrid is practical, but only with discipline#
For many teams, hybrid is the practical path. Use streaming where immediate insight matters, then run periodic batch reconciliation for efficient bulk reporting and validation. You get immediacy where timing matters and a validation checkpoint where trust matters more than speed.
The risk is drift. If stream and batch logic diverge, you create two answers to the same question and the operating burden rises quickly. Keep one metric definition with two execution modes where possible, and label provisional stream views and publish-checkpoint batch views clearly.
Do not migrate a metric to stream without these checks#
Before you move any metric from batch to an Event-Driven Pipeline, require a short evidence pack.
- Lineage is documented: source event or file, normalized event, ledger posting, metric output, and late or correction entry points.
- Replay behavior is documented: out-of-order events, state rebuilds, and correction handling.
- Alert ownership is documented: who owns ingestion lag, state-store failures, stuck consumers, and mismatch alerts.
Then compare stream and batch results over a normal publish cycle, including late arrivals and corrections. If the deltas are not explainable in plain language and traceable to source events, the metric is not ready to migrate. Batch already gives you a versioned, validated publish checkpoint, so move only when the stream path has the same accountability.
For a narrower payment-link view, see Payment Link Analytics: How to Track Which Clients Have Paid and When.
Design computation logic for correctness under change#
After you decide what runs in stream versus batch, the next risk is metric drift. If a number can change without a clear trail back to stored events, treat it as operational context rather than your reporting baseline.
Separate three layers on purpose: raw events, derived state, and presentation metrics. Raw events are what you ingest from internal services and providers. Derived state is your current interpreted state. Presentation metrics are what users see on cards and charts. That separation keeps fast views useful without blurring historical records.
Keep fast views and historical records on different rails#
A near-real-time dashboard can refresh every few seconds, but current-state cards are still best treated as provisional until reconciliation. That matters even more when ingestion spans multiple domains, because turning continuous raw events into clean live numbers is a non-trivial design challenge.
For each metric, define how late or corrected facts are handled before you publish it broadly. The goal is not a universal algorithm. It is an explicit, documented rule your team can explain and apply consistently.
Define update rules before publishing subscription metrics#
Subscription metrics are easy to display and easy to destabilize when the rules stay implicit. Lock these choices first.
| Metric | Rule to lock before publish | Drift risk if left vague |
|---|---|---|
| Monthly Recurring Revenue (MRR) | Which events change MRR and which timestamp is authoritative | Late updates can shift value across periods without a clear explanation |
| Net Revenue Retention (NRR) | Which states count as retained, expanded, contracted, or lost | Backfilled changes can alter cohort interpretation |
| Churn Rate | What counts as churn and how reactivation is represented | Delayed updates can create spikes that are hard to interpret |
Make correction paths visible#
When inputs are corrected, show that movement in the metric history or drill-down details instead of silently overwriting prior output. Reviewers should be able to tell whether movement came from new activity or from a correction.
This matters for margin-related metrics too. Payment gateway fees can materially affect profitability, and pricing can vary by country or program. For example, 2.9% + 30¢ per transaction, 0.25% + 25¢ per payout, and 3.5% managed-payments fees represent different cost patterns depending on context. If fee assumptions feed net metrics, keep the pricing context attached to the computation record.
Use a reportability gate#
Use a simple internal gate for executive reporting: only promote metrics when your team can recompute them from stored event history with the current rules. Metrics that fail that gate can still be useful on the dashboard, but treat them as operational signals until explanations are reliable.
Implement in the right order from ingestion to dashboard#
Build from contracts outward, not from tiles backward. If the UI ships before event validation, replayability, and reconciliation controls, teams end up acting on numbers they cannot explain.
One practical internal sequence is ingestion hardening, schema validation, ledger postings, metric jobs, then dashboard tiles. Treat it as a planning pattern, not a universal rule. The goal is traceability, so every visible number maps back to stored events and posting rules.
| Phase | What you are proving | Checkpoint to pass | What breaks if you skip it |
|---|---|---|---|
| Ingestion hardening | Events arrive, persist, and failures are owned | Explicit implementation status, clear ownership, and evidence of failure handling | Missing or delayed events become silent data gaps instead of incidents |
| Event schema validation | Payloads match your contract and evolve safely | Evidence that current payloads parse against the active contract and planned schema changes can roll out safely | Schema drift or malformed payloads corrupt downstream logic |
| Ledger postings | Financial movement is represented consistently | Event-to-posting mapping is documented, and third-party dependencies are marked Partial | Metrics can look stable while money movement is wrong |
| Metric jobs | Derived numbers can be recomputed from history | Recompute checks on known history slices, with unresolved gaps marked Partial or Future | Late arrivals and corrections create unexplained drift |
| Dashboard tiles | Presentation reflects verified semantics | Release only after upstream phases have explicit status labels and supporting evidence, not labels alone | Operators react to fast but unverified numbers |
Contracts before charts#
Define inter-service contracts before the first card or trend line. Producer and consumer teams should agree on event names, required fields, delivery identifiers, and correction behavior before chart polish starts.
If a metric depends on an unstable field or third-party dependency, mark it explicitly. Use blunt status labels such as Partial and Future instead of implying readiness, and keep Future bounded to a real window, for example six months, so roadmap risk stays visible.
Bring provider feeds in early, but keep your semantics canonical#
Use provider sample feeds early in contract tests, then verify that your event meanings still hold. Do not mirror provider-facing labels into your dashboard until the mappings are clear in your own model.
If you cannot explain how a provider event changes internal state, that metric is not ready for a real-time dashboard.
What each checkpoint should actually test#
Keep checkpoints narrow enough that operators can run them without debate.
| Checkpoint | What to confirm |
|---|---|
| Schema validation check | Current payloads parse against the active contract, and planned schema changes do not break existing consumers |
| Replay check | Rerun a known event slice through metric computation and confirm stored history reproduces the same outputs |
| Reconciliation check | Compare source totals, ledger totals, and metric outputs for the same period and investigate variance before release |
| Alert-routing check | Trigger an ingestion failure and a stale-data condition, then verify alerts reach the owning team with enough context to act |
A static dashboard can be too late to help, but a fast dashboard without these controls is hard to trust. Ship the visible layer after the control layer, and the numbers are much easier to defend under real operational load.
Build reconciliation and audit evidence into day one#
Trust is earned in reconciliation, not in the tile grid. Once core ingestion and posting checks are in place, make each critical number explainable against ledger records and provider references. If a tile cannot be reconciled, label it informational until that control is complete.
Keep one daily reconciliation artifact#
Near-real-time visibility helps teams react, but daily reconciliation keeps close and incident review from turning into guesswork. Keep one daily artifact per critical metric family with enough detail to compare provider totals, internal totals, and dashboard outputs. Then assign ownership and resolution timing when totals do not match.
Use the ledger as the system of record for money movement. A practical checkpoint is to compare provider sales or settlement reporting against internal totals each day and flag unexplained variance early instead of waiting for month end.
If you need to test alerting paths, use thresholds as examples rather than norms. Example triggers include approval rates dropping to 50%, downgrades above 2% of sales, or chargebacks above 20 in a day.
Make tiles explorable back to transaction evidence#
For each critical tile in your dashboard, define the drill-down path before polishing the chart. In practice, that means retaining transaction-level references so teams can trace from provider records to the ledger entries behind the number. Payment flows produce multiple lifecycle events from authorization through settlement, so a single status snapshot is usually not enough.
Teams get into trouble when a top-line card looks right but the underlying movement cannot be traced. If you cannot explain a balance change transaction by transaction, the tile is not ready for finance or audit use.
A practical verification step is to regularly pick a high-value tile and trace sample records end to end. Confirm that provider references, event timing, and ledger postings align with the number shown.
Keep the evidence pack small and repeatable#
Do not wait for an audit request to decide what evidence to retain. For high-impact metrics and incidents, keep a compact, repeatable pack with representative transaction evidence, documented variance findings, and a dated resolution summary with ownership.
A good test is simple. Hand yesterday's variance to another engineer or finance partner and ask them to trace it from provider reference to ledger entry using only the stored evidence. If they still need tribal knowledge or ad hoc production access, your controls are too thin.
For finance-owned reporting metrics, see Real-Time Reporting Metrics Platform Finance Teams Can Actually Control.
If you are turning this into an integration plan, use the Gruv docs to map webhook events, idempotent retries, and reconciliation surfaces before building dashboard tiles.
Handle predictable failure modes before launch#
Do not launch without predefined failure playbooks. In real-time payment operations, even a slowdown of a few minutes can disrupt thousands of transactions, and manual oversight gets harder at production speed and scale.
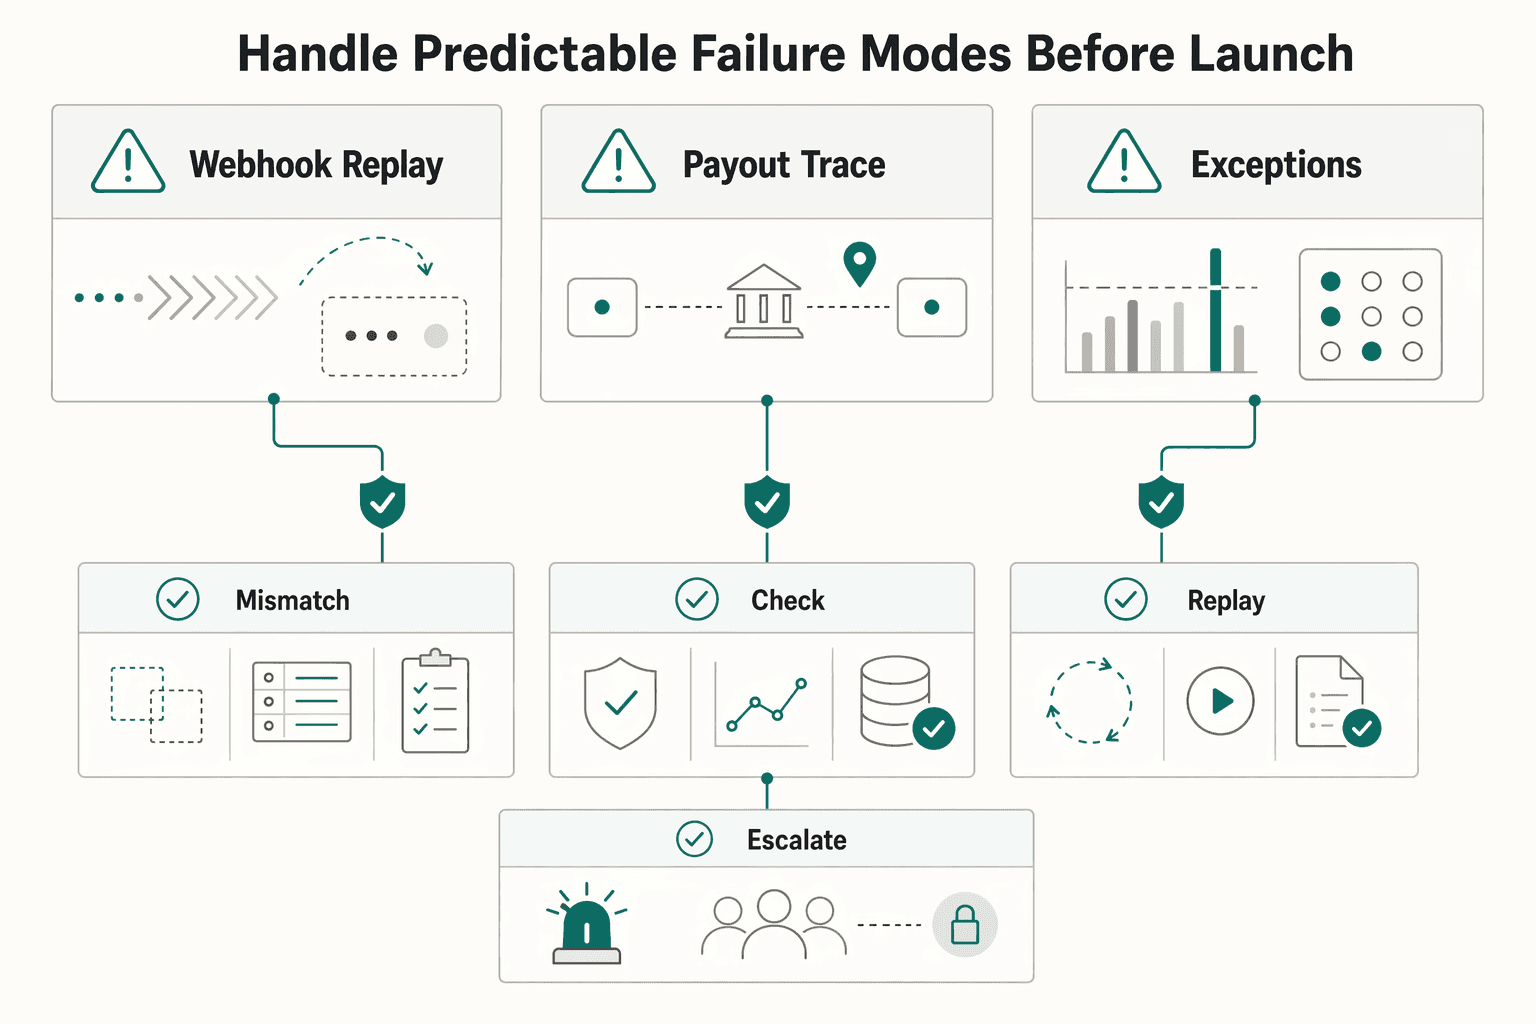
Use layered detection controls across your Event-Driven Pipeline instead of relying on one check. Predefine the failure classes your team will triage first.
- transaction-flow slowdowns that can escalate within minutes
- payout Webhook monitoring gaps in your payout-provider flow
- broken upstream or downstream dependencies
- gaps between detection controls across workflow stages
- fallback paths that cannot engage safely when detection fails
Make alerts action-first, not noise. For each alert, define the owning service, the first containment action, and the rollback path so responders are executing a plan instead of inventing one during the incident. Backups can support fail-safe operation, but only when detection is working.
Define one explicit degraded dashboard mode and switch to it fully during incidents rather than showing mixed-truth tiles from partially stale and partially live paths. In incident reviews, capture the root-cause class, metric impact radius, and whether any Batch Processing catch-up restored historical outputs for the affected window.
For related reading, see Accounts Payable Days (DPO) for Platforms in the Real Payment Cycle.
Plan delivery in phases with clear go no-go gates#
Roll this out in phases, and make each go or no-go call a structured evaluation, not an output-volume check. The goal at each gate is to confirm the dashboard is reliable enough to support decisions.
Phase by dependency, then expand#
Start with goals, requirements, and the minimum data path you can verify end to end. Expand scope only after teams are using consistent metric definitions and can trace results back to approved inputs.
Add broader performance and business views only when definition drift is under control across teams. Move into deeper analysis only after you can reliably reproduce prior outputs from recorded inputs.
Gate on verification, not polish#
Use a small phase-exit package that is hard to fake.
- evidence that key metrics are traceable to approved inputs
- evidence that metric definitions are consistent across teams
- evidence that reports or decisions can be reproduced under audit
This is a common failure pattern: polished surfaces can hide weak provenance, inconsistent definitions, and non-reproducible reporting. A data-lake-first push can also stall when governance asks what a metric is based on and who approved it.
A practical checkpoint before broad rollout is a pilot with a small team. It can expose process gaps before they scale.
Tie gates to payment context#
Payment-rail-specific thresholds and latency targets should be defined separately before you use them as go/no-go gates. For context, see FedNow vs. RTP: What Real-Time Payment Rails Mean for Gig Platforms and Contractor Payouts.
For the CFO visibility layer, see End-to-End Payments Visibility: How CFOs at Platform Companies Track Every Dollar in Real Time.
Account for country and program variability in payment flows#
Do not treat payment flows as one global pattern. Make market and program differences explicit in your metrics so normal regional behavior is not flagged as an exception, and real exceptions are not missed.
Model the differences instead of averaging them away#
Keep country, region, and cross-border flow as core dimensions, not just optional filters. Model settlement-side inputs too, since FX, fees, and delays can change how performance should be interpreted. When available, use source records such as transactions, fees, settlements, account balances, and invoices to explain payment status differences instead of collapsing everything into one status.
If you compare different payment rails, keep metric rules configurable by rail, market, and program. Avoid one global threshold or one exception rule for every context.
Verify assumptions before they become metrics#
Before locking thresholds in the dashboard, validate them against current source data across providers, banks, and internal systems. This helps catch rules that only fit one provider, one country, or one launch program.
A compact evidence pack can be enough.
- data source definition used for the metric
- sample source records for transactions, fees, and settlements
- the configured rule plus the operator-facing tooltip text
Add region-specific caveats directly in tooltips. When one view mixes markets where behavior is relatively predictable with markets where multiple payment methods coexist, say that clearly so operators do not over-generalize global performance. For implementation detail, see Webhook Implementation Guide: Real-Time Payment Notifications.
Conclusion#
Start with traceable metrics and explicit freshness targets, then expand into deeper Streaming Analytics only where lower latency changes a real decision. The dashboard earns trust when teams can explain what a number means, how current it is, and what action it supports.
Phased delivery often beats making every tile live on day one. Real-time dashboards are useful because they provide immediate visibility and support faster response, but data can still be available and too stale for the decision cadence. If a delay does not change the decision, near-real-time or batch can be the better tradeoff.
Treat freshness as a service target, not a vague promise. Define a Freshness SLI for how current data is relative to its source, then set a use-case SLO. An age-based rule can be enough, such as keeping data no older than 15 minutes, 99% of the time, when that matches the operational need. If you cannot instrument freshness and alert on stale data, the dashboard is not ready for real-time claims.
Build trust with clear go/no-go checks and a reconciliation-first rollout. Before you broaden real-time scope, verify data quality, latency behavior, and ownership of threshold alerts, then make sure teams are clear on which view is operational versus reconciled when those differ. That is what keeps a fast dashboard from becoming a mixed-truth dashboard.
Your next step should be short and concrete. Define freshness SLIs and SLOs per use case, including whether age-based freshness or source lag is the right measure. Pick a first wave of metrics tied to immediate action. Decide batch versus stream metric by metric based on whether lower latency changes outcomes. Schedule a freshness and reconciliation readiness review before expanding scope. Add stale-data alerts with clear owners so "available but outdated" is treated as a real failure.
When you are ready to validate market coverage, payout rails, and compliance gates for your rollout phases, talk with Gruv.
Frequently Asked Questions
What makes a real-time payment analytics dashboard different from a standard BI dashboard?
A real-time payment analytics dashboard updates as data is ingested, or on demand when a user requests the latest view, while standard analytics typically refreshes on a schedule such as hourly, daily, or weekly. In practice, payment teams use it to act on signals like approval rates, decline codes, fraud scores, and latency instead of waiting for end-of-period review. The quality bar is not just showing what happened, but helping operators understand why it happened and what to do next.
How real-time does our dashboard need to be for Ops versus Finance?
It should be driven by the use case, not by one global freshness target. Some workflows need updates every second, while others still work with updates every 15 minutes. If a delay does not change a real decision, near-real-time or scheduled refresh is usually enough.
When should we move from Batch Processing to Streaming Analytics?
Move when batch timing makes a metric materially less useful for decisions. Near-real-time can often be covered with micro batch processing before you commit to full streaming. Continuous updates can improve responsiveness, but they also increase infrastructure demand, so adopt them where the operational value is clear.
Which metrics should we compute in real time first for the biggest operational impact?
Start with signals that often drive immediate action: approval rates, decline codes, fraud scores, and latency. These are concrete payment analytics KPIs, but the right first set depends on which decisions your team needs to make quickly. If a metric does not change investigation or response behavior, it is usually a lower priority for the first real-time set.
How do Webhook and API reliability issues create dashboard mismatches?
The grounding here does not establish webhook or API reliability as a direct, proven cause of dashboard mismatches. A common mismatch pattern is uneven data freshness across sources. For example, one input can update continuously while another still arrives on a schedule, which can temporarily distort derived metrics. Keep freshness state and update timing visible so teams can distinguish data-lag effects from true performance changes.
How can we keep historical accuracy while still updating metrics continuously?
Treat continuously updated metrics as operationally time-sensitive, and keep scheduled reporting views clearly separated by cadence and purpose. This preserves fast decision support while keeping expectations clear for periodic reporting.
Try a related tool
Researched and edited by the Gruv editorial team. Gruv builds cross-border billing, payouts, and finance-operations software for global businesses.
Sources
Includes 3 external sources outside the trusted-domain allowlist.
- dublinohiousa.gov/dev/dev/wp-content/uploads/2019/05/Data-Stra...trusted
- elections.virginia.gov/media/formswarehouse/svrs/Exhibit-A-Requirem...trusted
- oklahoma.gov/content/dam/ok/en/workforce/documents/2024%2...trusted
- sec.gov/Archives/edgar/data/927971/00011931251649668...trusted
- ww2.arb.ca.gov/sites/default/files/cap-and-trade/regulation...trusted
- clickhouse.com/resources/engineering/what-is-real-time-anal...external
- fa.wordpress.org/plugins/smart-cycle-discountsexternal
- gooddata.com/blog/what-real-time-analyticsexternal
Educational content only. Not legal, tax, or financial advice.
Related Posts

When Instant Payout Matters for Gig Platform Payments
Instant payout is a tool, not the goal. The real operating decision is where instant timing creates measurable value, where batch timing is enough, and where both should run side by side.

FedNow vs RTP for Gig Platform Contractor Payouts
You are not choosing a payments theory memo. You are choosing the institution-backed rail path your bank and provider can actually run for contractor payouts now: FedNow, RTP, or one first and the other after validation.

Webhook Implementation Guide: Real-Time Payment Notifications
Payment webhooks are easy to stand up. Reliable payment operations are not. The difference comes down to a few architecture decisions you make early, before late or out-of-sequence events start showing up in production.