
Quick Answer
Yes. Use payout data as an early signal for contractor churn, then confirm risk with support and activity context before acting. Define operational states such as healthy, watchlist, intervention, and likely churn, and assign one owner per state. Start with an interpretable baseline like logistic regression or a shallow decision tree, not a black-box model. Treat each alert as useful only when it triggers a concrete retention or margin decision.
Why payout data can flag churn risk early#
Step 1 Frame churn as a supply problem#
Treat contractor churn as a supply problem first, with payments as a potentially useful early signal. If your payout signals cannot trigger a concrete save action or margin decision, they are analytics, not useful prediction.
That framing matters because churn does not mean the same thing in every business. Broad churn research connects churn to revenue and profitability, but a contractor marketplace is not a subscription app. A worker who stops accepting jobs after payout friction creates a different problem from a customer canceling a monthly plan. Your job is to catch supply risk early enough to support retention and margin decisions, not to borrow a generic SaaS retention score and assume it fits.
Start with one simple check: can you point to a recent contractor loss and show whether payout friction showed up before disengagement? If the answer is usually "we do not know," do not start with model tuning. Start by building the evidence trail.
Step 2 Build for usable alerts, not perfect prediction#
Do not wait for a perfect predictor. Build an early warning capability that helps product, finance, and operations act sooner, even if the first version is rough.
That mindset keeps teams from chasing false precision. Churn datasets often have class imbalance, where non-churn cases heavily outnumber churn cases, and that makes accurate prediction harder. A day-one model will miss some true risk and flag some contractors who would have stayed anyway. The practical test is whether flagged cases lead to better outreach, faster payout fixes, or smarter spend decisions than doing nothing.
Use a simple operating rule: every high-risk alert needs an owner and a next action. If no one knows whether to investigate payout failures, review support history, or hold off because unit economics are negative, the score will die in a dashboard.
Step 3 Set trust boundaries around the data#
Use payout data as a strong signal source, not as the whole story. Public research supports the broader point that support-related features can matter in churn prediction, but it does not give contractor-platform-specific benchmarks, and it does not prove payout-only data is enough.
Be explicit about what you know and what you do not. Payout signals may surface friction before a contractor goes quiet, but they are not definitive on their own. Support-related and behavioral context can help separate a payments issue from a demand issue or a temporary pause. One failure mode to avoid from the start is treating every payout issue as churn intent. Different non-churn situations can look the same if you only read payout records.
That is the boundary for the rest of this guide. Use payout data to improve your odds, pair it with behavior and support context, and label uncertainty clearly where contractor-specific public evidence is still thin.
What to prepare before you model anything#
Before you model churn, align on one churn definition, one intervention window, and one evidence trail your team trusts. Otherwise, you will spend more time debating labels and fixing joins than improving retention decisions.
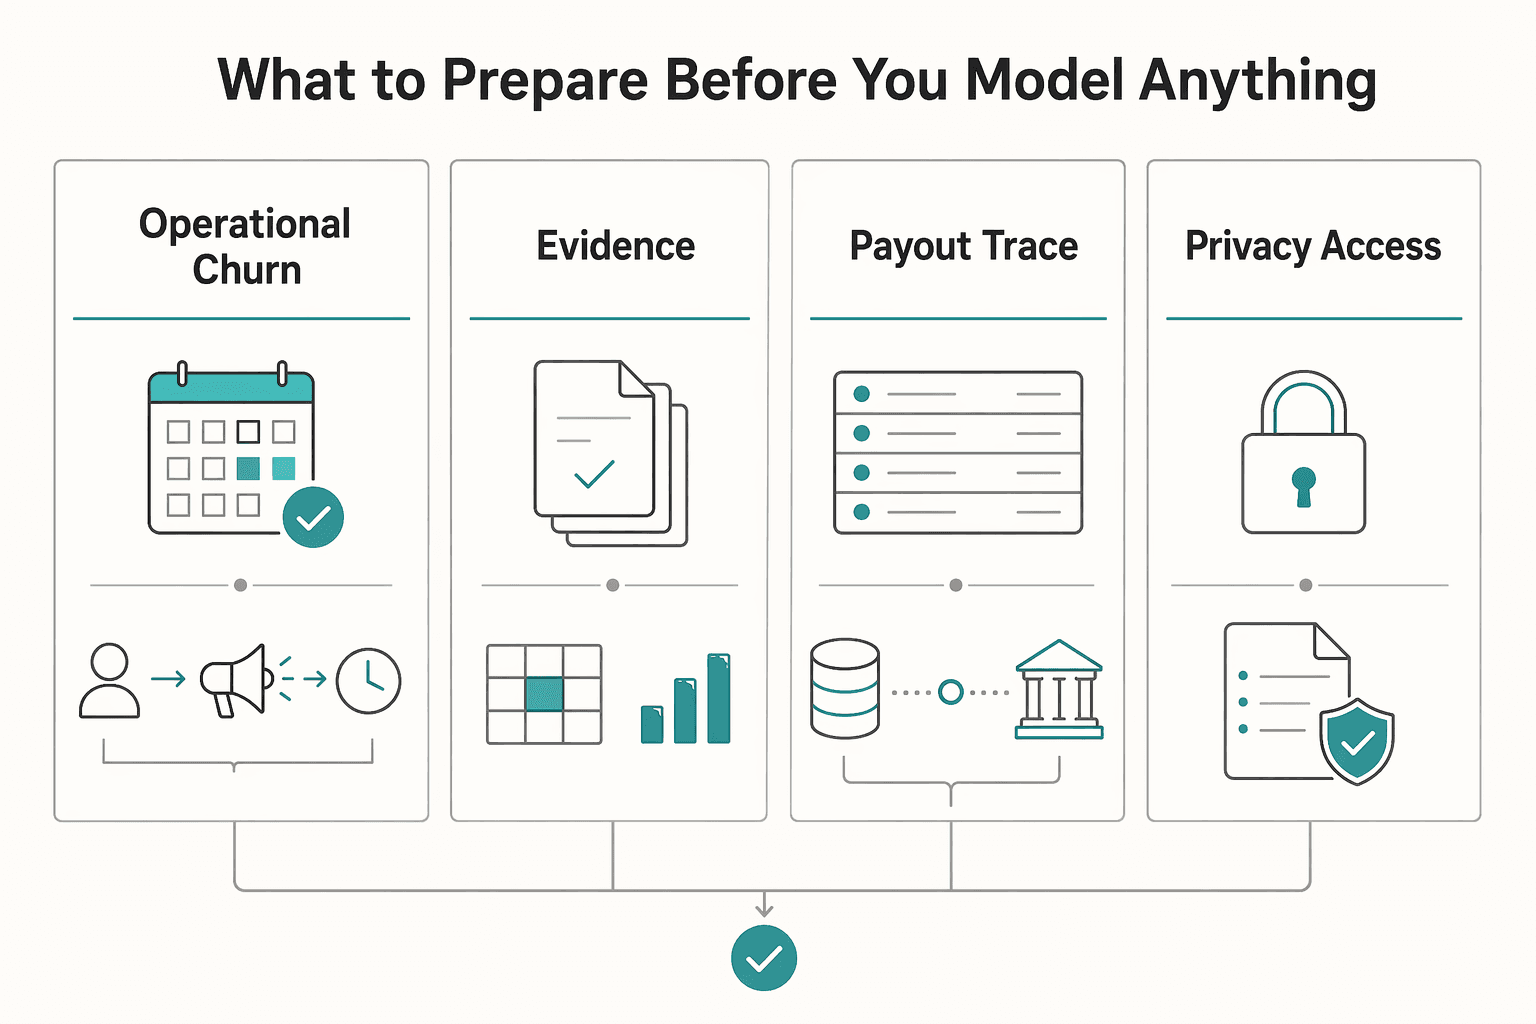
| Prep item | What to align | Why it matters |
|---|---|---|
| Operational churn outcome | Choose one churn definition your team can act on and pair it with an intervention window product and ops can actually meet | Keeps the team from debating labels instead of improving retention decisions |
| Evidence pack | Start with payout records, support history, and the health signals you already use; treat compliance states as context signals | Prevents payment issues from being read as disengagement intent by default |
| Traceability | Make sure analysts can follow the same record from event to ledger to export; document and validate join logic before feature work | Reduces guesswork in mapping and joins |
| Privacy and access guardrails | Decide which fields are masked, who can access raw identifiers, and which roles can export data before modeling starts | Reduces late-stage stalls in privacy or access review |
Step 1 Define one operational churn outcome. Churn varies by business model, so choose a definition your team can act on. For a contractor platform, that can be an inactivity outcome over a set window; pair it with an intervention window product and ops can actually meet. Use a simple check: when a contractor enters that window, who acts, what action is available, and how quickly?
Step 2 Assemble a minimum evidence pack. Start with payout records, support history, and the health signals you already use for risk or engagement. If you track compliance states (for example, KYC or AML holds), treat them as context signals, not churn by default. This keeps your team from reading every payment issue as disengagement intent.
Step 3 Confirm traceability before cleaning data. Make sure analysts can follow the same record from event to ledger to export without guesswork. If mapping depends on analyst assumptions, document and validate the join logic before feature work.
Step 4 Set privacy and access guardrails early. Decide which fields are masked, who can access raw identifiers, and which roles can export data before modeling starts. Early guardrails reduce late-stage stalls in privacy or access review.
For a related use case, see How to Use Payout Data for Contractor Segmentation: Identifying Top Performers Automatically.
Define contractor risk states your teams can act on#
Risk states should change action, owner, and response time, or they are just reporting labels. Use healthy, watchlist, intervention, and likely churn as internal operating states, then tie each one to a concrete workflow.
| Case type | How to treat it | Route or review |
|---|---|---|
| Payout-friction risk | Keep it separate from demand-side risk because payment issues can create involuntary churn signals | Route to payments/support operations first |
| Demand-side risk | Keep it separate from payout-friction risk so teams do not misdiagnose root cause | Route to product or marketplace operations |
| Compliance-gated pause | Track KYC, KYB, AML, and broader customer due diligence separately from likely churn | Keep a dedicated compliance status with timestamps in the dataset and review queues |
| Support tickets or sentiment | Use as context for prioritization, not as the churn label | Raise priority inside watchlist or intervention and require human review before final escalation |
Step 1 Assign a clear owner and action to each state. Treat the states as routing logic, not a universal churn taxonomy. For each state, define three things: who owns it, what evidence triggers it, and what happens within your intervention window. If those answers are still debated, the state definition is not operational yet.
Step 2 Separate payout-friction risk from demand-side risk. Keep payout-friction and demand-side risk as distinct flags so teams do not misdiagnose root cause. Payment issues can create involuntary churn signals, so a contractor can look disengaged because payout flow broke, not because they chose to leave. Route payout-friction cases to payments/support operations first, and demand-side deterioration to product or marketplace operations.
Step 3 Exclude compliance-gated pauses from churn labels. KYC, KYB, AML, and broader customer due diligence are compliance controls, not direct evidence of churn intent. Add explicit exclusion logic so policy-gated payout pauses are tracked separately from likely churn. At minimum, keep a dedicated compliance status with timestamps in both your dataset and review queues.
Step 4 Use support tickets and sentiment as context, not verdicts. Support signals are useful for prioritization, especially repeated payout complaints or slow handling patterns such as 24-48 hour response delays. But ticket volume or negative sentiment alone should not become the churn label. Use these signals to raise priority inside watchlist or intervention, then require human review before final escalation.
Related: Bad Payouts Are Costing You Supply: How Payout Quality Drives Contractor Retention.
Build the minimum viable signal set from payout operations#
Keep the signal set narrow, auditable, and operational: include only fields your team can explain, trace, and act on.
Step 1 Capture payout-friction events first. Start with payout delays, payout reversals, payout-method switching, failed payout retries, and payout batch exceptions. Treat them as friction indicators, not churn verdicts, and add weight when they repeat or cluster.
| Signal | Typical source | Cadence | Owner | Common failure mode |
|---|---|---|---|---|
| Payout delay | Processor status feed, payout ledger | Daily | Payments ops | Measured from the wrong start timestamp |
| Payout reversal | Ledger event, provider webhook | Daily | Finance or payments ops | Mixed with voluntary returns |
| Payout-method switching | Contractor profile, payout settings audit log | Daily | Product ops | Counted as risk even when user-initiated |
| Failed payout retries | Retry logs, provider response codes | Daily | Payments ops | Retries collapsed into one event |
| Payout batch exception | Batch export, treasury or ops exception queue | Intraday or daily | Payments ops | Visible in ops tools but missing from warehouse |
| Tax or onboarding friction | Tax doc queue, support case, onboarding status | Daily | Finance ops or onboarding | Missing timestamps on open requests |
Step 2 Pair payout friction with activity and engagement signals. Use activity and support inputs alongside payout events so one incident does not get over-read as churn intent. Route payout-friction-plus-stable-activity cases to payments ops first, and low-activity-without-payout-friction cases to product or marketplace ops.
Step 3 Add administrative friction markers carefully. Use W-8, W-9, 1099, and FBAR-related items as process-friction markers, not legal conclusions. For FBAR-related records, capture concrete status fields such as FinCEN Form 114 status and whether an amended report is required if errors are found in a previously filed FBAR. If maximum account value is stored, record it in U.S. dollars rounded up to the next whole dollar, use 0 when the computed value is negative, and value each account separately. For foreign-currency accounts, convert using the Treasury Financial Management Service rate for the last day of the calendar year. Missing required FBAR XML elements can cause rejection, so keep rejected submissions visible as friction signals.
Step 4 Document trust metadata for every signal. For each field, document source system, owner, update cadence, and known failure mode in the feature definition. Before launch, trace sample records end to end (raw event -> modeled field -> queue routing) and exclude any signal you cannot reliably audit.
Choose a baseline model your operators can understand#
Start with a model your team can explain and act on; add complexity only when it improves real decisions. If operators cannot explain why a contractor was flagged and what action follows, keep the model out of automated retention workflows.
Step 1 Start with an interpretable baseline#
Begin with logistic regression or a shallow decision tree so flags are easy to trace. The goal is operator clarity: for each scored contractor, keep the input snapshot, model version, score timestamp, and a short reason record (for example, top weighted factors or the tree path).
Before launch, validate traceability on recent high-risk cases. Operators should be able to map each flag back to source events such as payout ledger events, support queue records, or onboarding status. If they cannot, the baseline is not production-ready.
Watch for one common failure mode: incident learning. A batch payout exception or provider outage can trigger many simultaneous flags, even when the right response is incident handling rather than churn outreach.
Step 2 Test higher complexity only when action quality improves#
Once the baseline is stable, test XGBoost, neural networks, or ensemble methods only if they improve action quality. Promotion criteria should focus on better operational decisions, not just better validation metrics.
Use a true holdout set that remains untouched during model building. Compare baseline and candidate outputs on operator-relevant outcomes: explainability of flags, practical usefulness, and false-positive burden in review. If the complex model is harder to act on, keep it in testing.
Step 3 Check class imbalance and cohort stability before automating#
Class imbalance can hurt churn prediction performance, so check label distribution before concluding the model is weak. A December 2025 churn study on 7,043 telecom customers used sampling techniques with machine learning models to address class imbalance.
If positives are sparse, test weighting or sampling methods such as SMOTE, ADASYN, or CTGAN in training only, never in the holdout set. Then run stability checks across operational cohorts (for example, newer vs. established contractors, or recurring payout friction vs. clean payout history). If flag rates swing without a clear operational explanation, keep the model as decision support and delay automation.
For a broader look at retention, see Why Freelancers Leave Platforms and How to Fix Contractor Churn.
Turn risk scores into retention and margin decisions#
A risk score should change an owned action, or it is just reporting. Use a simple intervention ladder so each flagged contractor gets one clear next step.
Step 1: Assign one action and one owner per risk band. Start with a practical ladder and require a quick evidence check before acting.
| Risk band | Primary action | Owner | Verify before acting |
|---|---|---|---|
| Low risk | No-touch monitoring | Data or ops analyst | Score is not mainly driven by a known incident, compliance hold, or batch exception |
| Moderate risk | Automated outreach | Lifecycle or support team | Recent payout delays, failed retries, payout-method changes, and support signals |
| High risk | Manual ops escalation | Payments ops | Ledger events, retry history, onboarding status, and whether risk is payout friction or demand-side decline |
| Critical risk | Finance-led save review or controlled offboarding | Finance + ops | Current unit economics, unresolved payout problems, and whether a save action is commercially justified |
Quality-check this ladder with recent cases: each contractor should land in one queue with one owner.
Step 2: If payout friction is the driver and economics are positive, fix payout quality before incentives. Incentives can buy time, but they do not remove payout defects. Use an evidence pack before deciding: latest payout ledger events, retry history, payout-method switches, support context, and any compliance status that explains pauses. If the account is already margin-negative, route to controlled offboarding instead of defaulting to save offers.
Step 3: Feed risk into forecasting before plans harden. Customer losses can skew forecasts, stall growth, and erode revenue, so rising at-risk contractor pools should change supply assumptions. Carry two planning views: raw forecast and risk-adjusted forecast. Then backtest both against actual cohort outcomes and keep adjustments that help you spot red flags earlier or limit losses.
Step 4: Compare intervention cost, expected retention effect, and time-to-impact before scaling. This prevents the common "predict but do nothing useful" failure mode. Keep a short decision sheet per intervention with owner, evidence check, cost, expected effect, and expected time-to-impact. Maintain a monitoring and feedback loop so slow or expensive actions do not crowd out faster fixes.
Research on more than 100 failed digital ecosystems found that tracking stage-appropriate metrics and red flags helps teams pivot or limit losses. Related reading: How HR Platforms Scale Employee Recognition Payout Disbursements.
Operationalize in product and finance without losing control#
Operational control comes from one risk signal creating one traceable action under one clear rule. Keep the workflow inside systems teams already use, then review performance and governance on a fixed cadence.
Step 1 Assign one owner per decision layer#
Use a clear split by decision type:
- Product owns instrumentation quality.
- Finance owns economic thresholds.
- Payments ops owns execution SLAs.
- Data owns model monitoring and drift checks.
For any flagged contractor, your team should be able to answer quickly: what triggered the case, what threshold was crossed, who owned the next action, and what happened next.
Step 2 Put the signal where work already happens#
Surface the score, key driver context, and required next action in existing tools such as Salesforce Einstein, Gainsight, or your internal dashboards. Churn prediction is only useful when teams can act on it in their normal workflow, and combining CRM context with commercial activity can improve detection quality.
Keep the evidence pack beside the score so operators can act with context: payout status, retry history, payout-method changes, support signals, and any compliance state that affects intervention.
Step 3 Make triggers idempotent and auditable#
Build triggers so the same contractor in the same risk state and intervention window creates one action record, not duplicates across Merchant of Record flows, payout status updates, and support actions.
Store a durable audit trail for each action, including intervention ID, source event, model version, timestamp, and final disposition. This prevents duplicate outreach, inflated case counts, and avoidable overrides when status events change quickly.
Step 4 Run monthly governance checks#
Run a monthly review for drift, false positives, and privacy controls. Check whether score behavior is still stable, whether false positives are rising by cohort, and whether recent spikes reflect true churn risk or operational issues like provider incidents or compliance backlogs.
Include privacy in the same review: confirm masking is still enforced, role access still matches job need, and case views expose only the payout detail teams need. For related privacy handling, see GDPR for Marketplace Platforms: How to Handle Contractor and Seller Personal Data Compliantly. For an adjacent retention lever, see How Gig Platforms Can Use Earned Wage Access (EWA) as a Contractor Retention Tool.
Common mistakes and how to recover fast#
The fastest recovery is to simplify: fix labels, reset model scope, and require an owned response workflow before you tune anything.
| Mistake | Recovery | Required reset |
|---|---|---|
| Treating payout failures as churn intent | Separate operational payout incidents from true churn labels before retraining | Split provider incidents, compliance holds, and contractor choice changes before relabeling |
| Adding model complexity before data quality is stable | Return to an interpretable baseline and improve cleaning and preprocessing first | Fix feature lineage, ownership, update cadence, and timestamp alignment |
| Enabling alerts without an operator playbook | Require a documented churn-prevention workflow with a named escalation owner before alerts go live | Define who acts, what action is allowed, and when the case expires |
Mistake 1: Treating payout failures as churn intent#
Recovery: separate operational payout incidents from true churn labels before retraining. Payment issues can signal involuntary churn, and broad label definitions can misclassify normal delays as risk. At minimum, split provider incidents, compliance holds, and contractor choice changes, then relabel only cases with clear cause evidence.
Mistake 2: Adding model complexity before data quality is stable#
Recovery: return to an interpretable baseline and improve cleaning and preprocessing first. If feature lineage, ownership, update cadence, and timestamp alignment are weak, added complexity usually hides defects instead of improving decisions. One pilot case reported vendors claiming 90%+ accuracy while failing to ingest payment data with matching timestamps, which is the failure mode to avoid.
Mistake 3: Enabling alerts without an operator playbook#
Recovery: require a documented churn-prevention workflow with a named escalation owner before alerts go live. For every alert, operators should know who acts, what action is allowed, and when the case expires. Early signals can appear before formal cancellation, but they only help when the response path is already defined.
For a step-by-step walkthrough, see Virtual Credit Cards for Platforms: How to Issue Single-Use Cards for Contractor and Vendor Payments.
Conclusion and copy-paste launch checklist#
Start simple, but make every alert earn its keep. The right first version is not the most sophisticated model. It is the one with clean data, clear risk states, an interpretable baseline, and a retention action that protects supply, margin, or both.
- Define one churn outcome and one intervention window.
Pick a single operational definition your teams will not debate every week, then choose the window in which product, payments ops, or finance can still act. A good verification check is simple: can two reviewers look at the same contractor record and agree whether the outcome happened? If you cannot answer that cleanly, your labels will drift and your model results will look better on paper than they do in practice.
- Verify data definitions and controls before feature work.
Confirm your status definitions are consistent across source systems and exports, especially for retries, reversals, batch exceptions, and payout-method switching. Also confirm access boundaries for sensitive contractor data. A common failure mode is building features from mixed-status exports where provider outages, compliance holds, and contractor choice changes are bundled together as one "failed payout" signal.
- Launch an interpretable baseline and validate by cohort.
Start with logistic regression or a small decision tree, then test it on a holdout set and review stability across meaningful cohorts. Where relevant, evaluate churn and payment behavior together rather than in isolation. Do not move to a more complex approach if operators cannot explain why someone was flagged. One useful outside reminder comes from a churn and payment prediction context beyond marketplaces: historical evaluation alone is "not convincing enough without real-world tests." Your checkpoint is not just model performance. It is whether the flagged cases make sense in live review.
- Map each risk band to an owned action.
Give healthy, watchlist, intervention, and likely-churn states a named owner and a concrete next step. If payout friction is the issue and unit economics are still positive, route to payout-quality fixes first. If the contractor is unprofitable, route to controlled offboarding instead of incentive spend. If no one owns the save action, you do not have a churn program yet. You have a scoring exercise.
- Add a monthly review for drift, false positives, and economics.
Review a sample of alerts, compare intervention cost with observed retention outcomes, and log where the model misfired. Pay special attention to policy-gated pauses (for example, KYC/KYB/AML checks where applicable) so those cases do not leak back into training data. The output you want each month is a short evidence pack: what changed in the data, which alerts were wrong, which actions paid off, and which thresholds need adjusting.
If you want one rule to carry forward, use this: if a churn alert does not trigger a decision you trust, do not scale it yet.
Frequently Asked Questions
Can platforms really use payout data to predict contractor churn, or is it too noisy?
Yes, but treat payout data as an early warning signal, not a full explanation of churn intent. It can get noisy when multiple operational causes are mixed together, so clean event labeling and timestamps matter. Payout data alone is usually not enough; adding behavioral context is important for stronger churn prediction.
What is the minimum viable signal set if we only have basic payout data and support tickets?
Start with consistent, timestamped behavioral signals from payout events and support interactions. That can support a baseline model if you also document source system, owner, and update cadence for each field. Treat this as a starting point, not a complete signal set.
Who should own contractor churn prediction across product, finance, and payments ops?
Do not assign it to one team in name only. Use cross-functional ownership, but make one owner explicitly accountable for intervention execution after a score is generated. If no one owns the save action, the prediction work will not create value.
Which model should we start with: logistic regression, decision trees, or XGBoost?
Start with an interpretable baseline, then compare alternatives on your own tabular CRM-style data. Avoid treating any model choice as universally best. Vendor-stated benchmarks suggest tree-based methods often perform well in tabular settings, but model selection should depend on your data and explainability needs.
How do we avoid mislabeling compliance related payout blocks as churn risk?
Treat compliance-related payout blocks as separate from churn outcomes when defining labels and review logic. Policy-gated pauses can look like risk events in raw payout logs, so keep clear status context before training or scoring.
What does “good” look like in the first 90 days of a churn prediction strategy?
Good means you have one agreed churn outcome, one intervention window, a baseline model, and a documented retention path by risk tier. Risk-tiered interventions are generally more effective than one-size-fits-all retention actions. The early phase is about trustworthy data and consistent action, not claiming mature automation.
What can we not claim yet because contractor specific public benchmarks are limited?
You cannot claim that payout data alone predicts churn reliably across contractor platforms. You also should not present vendor-stated figures like 85-92% accuracy or 15-25% churn reduction as contractor benchmarks. Public excerpts support a narrower point: behavioral features can improve model performance, and prediction only matters when tied to retention workflows.
Try a related tool
Researched and edited by the Gruv editorial team. Gruv builds cross-border billing, payouts, and finance-operations software for global businesses.
Sources
- bsaefiling.fincen.gov/docs/XMLUserGuide_FinCENFBAR.pdftrusted
- fincen.gov/reporting-maximum-account-valuetrusted
- fincen.gov/report-foreign-bank-and-financial-accountstrusted
- humanecology.ucdavis.edu/sites/g/files/dgvnsk161/files/media/document...trusted
- pmc.ncbi.nlm.nih.gov/articles/PMC10074358trusted
- pmc.ncbi.nlm.nih.gov/articles/PMC10707658trusted
- sec.gov/Archives/edgar/data/1169138/0001641172250046...trusted
- stripe.com/resources/more/how-to-build-a-customer-churn...trusted
Educational content only. Not legal, tax, or financial advice.
Related Posts

How to Use Payout Data for Contractor Segmentation and Identify Top Performers Automatically
**If you only sort by one headline metric, you can reward size rather than contribution.** Most teams can see the biggest numbers. Far fewer can show which groups create durable value in a way multiple teams trust. That is where segmentation starts to matter. A one-size-fits-all approach leaves value on the table.

Bad Payouts Are Costing Your Supply in Two-Sided Platforms
Payout issues are not just an accounts payable cleanup task if you run a two-sided marketplace. They shape supply-side trust, repeat participation, and fill reliability. They can also blur the revenue and margin signals teams rely on.

Prepaid Cards as a Payout Method: When They Work for Platforms and When They Don't
Prepaid cards are a real payout option, but they are not a shortcut to sound payout design. If you run payouts for a marketplace platform or embedded payments product, the question is not just whether a rail moves money fast. It is whether the rail fits your use case and operating model.