
Quick Answer
Build the payment health dashboard for platforms as a daily operating surface: pair Payment Analytics for drift detection with Payment Details for record-level diagnosis, then lock KPI formulas, owners, and escalation triggers before launch. Add API and webhook reliability checks with idempotent handling, and require daily close-readiness validation across ledger outcomes, settlement status, and bank-match evidence. Remove any metric that does not change an operator decision.
What a payment health dashboard needs to cover#
A useful payment health dashboard for platforms is a daily operating surface, not a single chart. It should help teams see what needs action before reconciliation and reporting delays stack up. If it cannot point to the next fix, it is reporting, not payment health.
The main risk is fragmented or delayed payment data. The source material behind this guide describes teams spending hours in scattered records, waiting on delayed insights, and relying on manual reporting that slows reconciliation and decisions. Build against that failure mode by shortening the path from "something looks off" to the exact record that needs action.
A practical starting structure is 2 linked views: Payment Details and Payment Analytics. Payment Details supports transaction-level investigation. Payment Analytics supports summarized trends and prioritization. Together, they let you move from signal to root cause without waiting on ad hoc reporting.
Keep the boundary clear. These views support investigation and prioritization, but they do not prove ledger integrity on their own. Include verification checkpoints so teams can trace a summary signal down to the underlying record and back to the related ledger or payout reference.
Before you start. Use trusted inputs and an access pattern that does not create more operational risk. One implementation highlights querying a data warehouse without affecting production systems. That is a strong fit when your team still depends on exports or manual query handoffs.
Design for on-demand analytics, not periodic batch reporting that arrives after the decision window has closed. When payment status is stale, teams can spend time on the wrong issue. Treat freshness, drillability, and record-level verification as core product requirements from day one.
This guide stays operational on purpose. Define payment health in practical terms, align inputs and joins, map the money flow, assign metric owners, and add alerting, recovery, and verification checkpoints. The goal is daily visibility for faster decisions on reconciliation status, payout operations, and potential failures.
For a step-by-step walkthrough, see Account Reconciliation for Payment Platforms: How to Automate the Match Between Payouts and GL Entries.
Start with a payment health definition your teams can actually operate#
Start with ownership and action, not charts. If a metric does not tell someone what to do next, it likely does not belong on the dashboard.
Step 1 define scope around practical troubleshooting#
Set scope as a working model for your team, not a universal standard. Prioritize signals with end-user impact and practical value, so operators can move from detection to remediation instead of collecting passive status indicators.
Step 2 pair overview signals with detail-level investigation#
Build the section so teams can start with an overview and move into details for the same issue. That helps prevent reactive investigation loops and gives operators enough context to diagnose and resolve problems.
Step 3 lock one reliability signal and one response pattern#
Pick one shared reliability signal, define it once, and assign a clear owner and review cadence. Track it over a fixed recent window, for example 28 days, so trend changes are comparable. Then document the response rule beside it: who acts, what they check, and when they escalate.
For ERP handoffs and finance system mapping, see ERP Integration for Payment Platforms: How to Connect NetSuite, SAP, and Microsoft Dynamics 365 to Your Payout System.
Gather the right inputs before you build anything#
A usable dashboard starts with disciplined inputs, not chart design. Before you build a single tile, make sure your sources, record mapping, and metric evidence are clear. An operator should be able to trust what they see and trace it back to a record.
Step 1 inventory the sources that explain payment state#
Start with a source inventory, not a KPI brainstorm. Dashboards usually combine multiple systems, so centralize sources, remove duplicates, fill gaps, and standardize formats before reporting.
Focus on the minimum source set that explains performance and supports real decisions. Effective setups connect existing data sources, keep updates current, and make insights accessible to technical and non-technical teams.
Run short interviews with key decision-makers before you finalize metrics. If a source does not support a real decision, leave it out for now. This is also the point where you avoid tool or data-model choices that do not match how your team investigates exceptions.
Step 2 define how records reconcile across sources#
If records are hard to reconcile across sources, downstream metrics are harder to trust. Define your matching rules up front and test them with real records before dashboard work starts.
The exact identifiers vary by environment, but your reconciliation approach needs to hold up across updates and review workflows.
Use a quick traceability check with recent records. Confirm each one can be followed across the systems used for operational and finance reporting. If records still require manual interpretation, your reconciliation plan is not ready.
Step 3 align KPIs to decisions before rollout#
Pick KPIs that map directly to business objectives and operator decisions. If a metric does not change an action, keep it out of the first release.
Where possible, rely on automated integrations for those KPI inputs so reporting stays accurate and supports a single trustworthy source of truth.
Step 4 build an evidence pack for every metric you ship#
Before you publish metrics, create a simple evidence pack for each one: formula owner, data source owner, refresh cadence, and acceptable latency window. That gives you a reliable baseline when a number changes.
| Evidence field | What to record |
|---|---|
| Formula owner | Include for each metric |
| Data source owner | Include for each metric |
| Refresh cadence | Include for each metric |
| Acceptable latency window | Include for each metric |
| Exact source feeds or tables | Record the exact source feeds or tables |
| Who approves logic changes | Record who approves logic changes |
If you are starting fresh, keep the first release to about 8-12 critical KPIs. For each metric, record the exact source feeds or tables and who approves logic changes. If a widget looks wrong or stale, your team should be able to identify ownership and current data status quickly.
For a reconciliation-focused view, see How to Build a Payment Reconciliation Dashboard for Your Subscription Platform.
Step 1 map the money path from collection to payout#
Map the money path before you design tiles. If the path is unclear, the dashboard will be harder to trust and harder to use under pressure.
Draw the core path your business actually runs#
Start with the order of operations your team really uses, not a borrowed template. Your flow chart should work as a roadmap that shows how each step connects to your accounting system, and it should reflect your actual business model.
A starting draft can include invoice intake, matching checks, approvals, payment processing, settlement tracking, and exception handling, then be adjusted to match your process.
| Stage | What to confirm | Example local break label |
|---|---|---|
| Invoice intake | The invoice or payment request is present and traceable | Intake missing |
| Matching check | Any required two-way or three-way matching is complete | Match exception |
| Approval and routing | The item reaches the right approver or queue | Approval blocked |
| Payment processing | Payment is initiated and status is tracked | Processing delay |
| Settlement tracking | Settlement status is updated and reviewable | Settlement issue |
| Exception handling | Open exceptions have a documented next step | Unresolved exception |
If matching is a key checkpoint in your environment, show it explicitly.
Keep alternate paths and decision points on the same map. If a non-standard path changes timing or customer impact, represent that branch directly so operators can see where work shifts. Mark where operational decisions happen and where exception handling or settlement tracking is required. Do not let unresolved items sit in the flow with no clear next action.
Tag failures so every dashboard tile maps to a known break type#
Use a small set of local break labels and apply them stage by stage so counts trace back to real investigations. A quick check is to trace recent normal and exception cases through the map. If the break type or resolution path is still unclear, give the map one more pass before you build tiles.
Step 2 choose a KPI dictionary with formulas and owners#
Define your KPI dictionary before finalizing dashboard tiles. If two teams use the same metric name with different formulas or owners, the dashboard will be harder to trust and harder to act on.
A KPI should be defined tightly enough to monitor and improve outcomes, not just report activity. Keep definitions centralized so finance, ops, and product are not working from disconnected reports.
Build the dictionary before you build the widgets#
Start with a compact table and expand only where disputes keep happening. A practical template can include metric name, formula, data source, owner, cadence, action trigger, escalation path, and a required "what changed" cut.
| Metric | Formula to lock | Primary source | Owner | Cadence (team choice) | Action trigger | Escalation path | What changed cut |
|---|---|---|---|---|---|---|---|
| Reconciliation break rate | Team-defined numerator, denominator, exclusions, and when an item becomes a break | Ledger + reconciliation status | Finance ops | Documented and fixed | Written and explicit | Named finance/payments lead | Provider, rail, segment, aging |
| End-to-end payout completion rate | Team-defined start state, completed state, and reporting window | Payout processor status + internal payout records | Payments ops | Documented and fixed | Written and explicit | Named payout operations manager | Rail, corridor, processor, batch |
| Timeliness (if practical) | Team-defined interval, clock start/stop, excluded pauses | Event timestamps + payout/settlement status | Ops or product | Documented and fixed | Written and explicit | Named delay-handling owner | Provider, rail, time window, tier |
| Denials or collection rate (if relevant) | Team-defined event counted and why it changes an operating decision | Billing, collection, or remittance data | Finance/revenue owner | Documented and fixed | Written and explicit | Named functional owner | Provider, payer, segment, reason |
The standard to aim for is reproducibility. A new operator should be able to calculate each metric from source data without tribal context.
Separate operating metrics from vanity metrics#
Include metrics only when they map to a real operating decision with a named owner. If a metric crosses a trigger, someone should know exactly what changes today.
Legacy KPIs often fail both operationally and strategically when assumptions are not revisited. Re-check your dictionary when the money path changes so old definitions do not quietly become noise.
Document the exact role of supplemental remittance data#
If your workflow uses remittance-style data, define whether it is required evidence to close reconciliation items or informational context after close. Labeling this explicitly helps prevent overstating match quality or delaying close because non-blocking data arrives late. See also Payments for Healthcare Staffing Platforms: Compliance and Speed Requirements.
Make every KPI debuggable#
Every KPI needs a built-in diagnostic path. "What changed" should mean predefined cuts, for example provider, corridor, payout rail, or customer segment, not free-text investigation after an alert.
Before launch, hand-calculate each KPI for one recent good case and one recent broken case, then confirm the dashboard matches. If operators cannot explain movement after a filter change, tighten the definition.
Version-control definitions so history stays honest#
Store KPI definitions in a versioned location with effective date, change note, and approving owner. Record formula text, included and excluded states, source tables, timezone, late-data policy, and diagnostic cuts.
Version control helps, but you still need to validate that your reporting layer preserves or labels the metric version used in historical periods. Some native KPI features are still incomplete in certain tools, so verify behavior before you treat long-term trends as authoritative. Related: Real-Time Payment Use Cases for Gig Platforms: When Instant Actually Matters. If you want a clean implementation reference for event states, retries, and operational status handling, review the Gruv docs.
Step 3 design the dashboard views by operator decision#
Design the dashboard around operator decisions, then make every signal drill into the underlying records. Keep the two-layer model from the introduction, then split it into role-based views with a consistent drill-down experience.
Dashboards work best when they combine process-health signals with transaction detail. If you only show trends, it becomes harder to investigate specific issues. If you only show records, it becomes harder to spot bottlenecks and movement over time.
Split views by role and keep drill-down consistent#
Use role-based views, and make sure each one can drill into underlying data when operators need to investigate.
| View | Default question | Top-layer emphasis | Drill target |
|---|---|---|---|
| Process health view | Where is performance slipping? | KPIs, alerts, trends, and metrics | Filtered transaction and invoice records |
| Aging and lifecycle view | What is aging or stalled? | Invoice aging and lifecycle status | Matching invoice records and status details |
| Vendor and approvals view | Where is risk concentrated? | Vendor information, error rates, and approval times | Vendor- or status-filtered records |
Verification check: open an alert tile and confirm it resolves to the matching filtered record set.
Pair aggregate panels with record-level panels#
Use a two-layer pattern: aggregate panels for drift, detail panels for root cause. Aggregate tells you whether performance is moving. Detail tells you which records, which statuses, and who owns the fix.
If a chart cannot open directly into its filtered records, it behaves like reporting, not operations. A practical checkpoint is whether an alert tile opens the matching record set without forcing you to rebuild filters somewhere else.
Only add comparison panels when they change action. For segments with many vendors, optional comparison panels can help surface concentration by vendor or status. Keep them optional and tie them to decisions. Owner, queue, or next action should change based on what the panel shows.
Make each widget answer one action question. Before you keep a widget, test it against these prompts:
- What failed?
- Who owns it now?
- What action is next?
- By when does it need attention?
If a widget cannot answer most of these without extra hunting, redesign it or remove it.
Related reading: Accounting Cycle for Payment Platforms: How to Structure Month-End and Quarter-End Close.
Step 4 set alert thresholds and escalation rules#
Set thresholds by action urgency, then route each alert to the owner who can act in time. Page only on states that need immediate intervention, and keep trend monitoring on a slower review path so the pager stays credible.
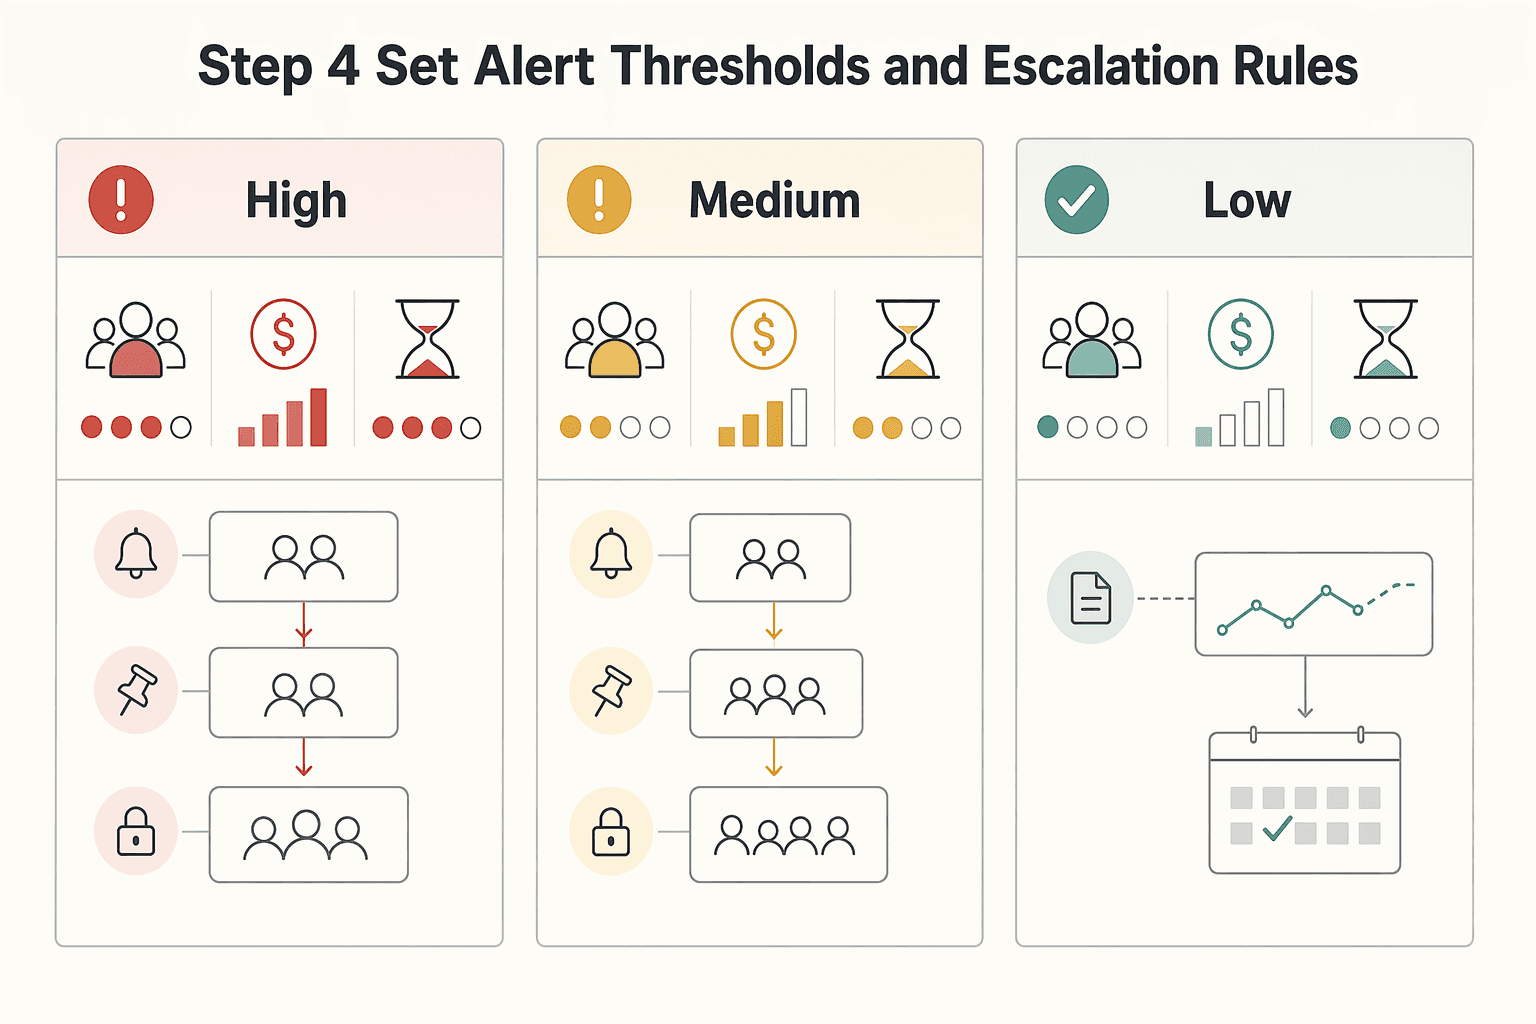
Start with a severity matrix based on customer impact, financial risk, and time sensitivity, then map each severity to a route and escalation chain.
| Severity | Use when | Route | Expected operator action |
|---|---|---|---|
| High | Customer impact is active, funds movement is blocked, or financial exposure can grow before the next review | Primary incident route with immediate escalation | Triage immediately, confirm affected records, and stop harmful retries if needed |
| Medium | Issue is contained but can affect close, payout timing, or exception volume if left alone | Team queue with timed escalation | Investigate the same working day, assign owner, confirm next action |
| Low | Trend-only drift or informational change with no immediate operator action | Dashboard review or digest | Monitor, compare to baseline, and tune noisy thresholds |
Use threshold types intentionally. Fixed thresholds fit hard-stop conditions. Baseline-driven thresholds fit variable trends. Static thresholds can miss anomalies and need manual tuning, while dynamic thresholds depend on history and can drift. In practice, that often means fixed alerting for hard-stop states, with baseline-aware alerting for trend movement.
Write explicit if-then handling for retries. If retries exceed your chosen threshold and state is unchanged, stop auto-retry and assign manual investigation. Check current status and the latest system response before retrying again.
Set freshness by decision need, not chart type. Failed payouts and policy holds should refresh on a fast operational cadence because action is immediate. Trend-only analytics can run at a slower cadence when they are used for pattern review.
Create two escalation maps with clear ownership and handoff criteria:
- Timeliness degradation map: who responds first, when to hand off across teams, and when finance visibility is required.
- Reconciliation break rate map: who validates the metric, who validates records, and who decides close impact.
Before you enable alerts broadly, confirm at least one alert integration is configured and test routes end to end. Trigger one synthetic high-severity alert and one medium-severity alert. Verify they land in different paths, and verify each opens the exact filtered record set needed for action. If thresholds can be inherited, document lower-level overrides so local rules do not quietly replace the global standard.
Step 5 connect API and Webhooks with idempotent event handling#
Treat API writes and webhook reads as one reliability surface. If writes say a payment changed but webhook intake is delayed, duplicated, or rejected, the dashboard can look healthy while ledger state and operator queues fall out of sync.
Define the event contract#
Document event order per provider or producer, not as a universal payments rule. For each integration, define what the API initiates, which webhook confirms or advances state, which late events are acceptable, and which stale events must be ignored or parked for review.
| Contract item | Define |
|---|---|
| What the API initiates | Define what the API initiates |
| Webhook that confirms or advances state | Define which webhook confirms or advances state |
| Late events | Define which late events are acceptable |
| Stale events | Define which stale events must be ignored or parked for review |
| Customer-facing state | Define which event is authoritative for customer-facing state |
| Ledger posting | Define which event is authoritative for ledger posting |
| Out-of-order behavior | Define what out-of-order behavior is acceptable before a record is marked degraded |
Make the contract answer three operator questions:
- Which event is authoritative for customer-facing state.
- Which event is authoritative for ledger posting.
- What out-of-order behavior is acceptable before a record is marked degraded.
Webhooks push data when something happens instead of forcing repeated polling checks when nothing changed. That gives you faster awareness, but events can still arrive late, arrive more than once, or fail verification. These behaviors need explicit handling rules.
A practical handling rule is simple. If an older event would move a record backward after a newer confirmed state exists, suppress the state change and log the event for traceability. If an out-of-order event adds missing evidence, ingest that detail without reopening the record.
Enforce idempotent handling end to end#
Use fast acknowledgments, queue-first ingestion, idempotent processing, disciplined retries, and observability. In practice, validate signatures, persist raw payload plus metadata, return quickly, and process asynchronously from a queue instead of doing heavy work inline.
Apply idempotency across webhook retries, job retries, and API retries so they resolve to one state transition. Use a stable deduplication key, store the first successful processing result, and make downstream mutations check whether the event was already applied.
Be explicit about limits. Idempotent processing prevents repeated state changes from repeated delivery, but it does not guarantee exactly-once delivery. You still need recovery paths for undelivered and irrecoverable events.
Expose the technical counters that show truth. Include a small set of transport and processing counters next to finance metrics in the dashboard.
| Counter | What to measure | What it tells you |
|---|---|---|
| Delivery lag | Time between provider event creation or send time and your successful receipt or enqueue time | Whether inbound state is fresh enough for operator decisions |
| Processing failures | Count of events that failed validation, transformation, or downstream handling | Whether records are getting stuck before ledger or status updates |
| Duplicate suppression count | Count of replayed or repeated events intentionally ignored after first successful apply | Whether retries are controlled or duplication pressure is growing |
Make each counter drillable to event IDs, entity keys, and current processing state.
Add verification checkpoints before you trust the view. Use three recurring checkpoints:
- Sample event-to-ledger traces to confirm expected status or ledger updates are applied once.
- Surface webhook signature validation status. If validation is failing, unknown, or disabled, treat that feed as degraded.
- Track unresolved undelivered and irrecoverable events with a named owner. Rising backlog paired with delivery lag or processing failures is an ingestion reliability problem first.
Once you can verify event authenticity, trace state into the ledger once, and see retries suppressed instead of amplified, the alerts from Step 4 become much more trustworthy.
If SAP sits downstream of your payout operations, see SAP Integration for Payment Platforms: How to Connect Your Payout Infrastructure to SAP ERP.
Step 6 add compliance gates without blinding operations#
Put policy state directly in the same operational view as payout state so teams can see whether money is delayed by review or by execution. Show policy holds beside payout status, and keep policy-blocked states visibly separate from rail-execution failures.
Show policy state where operators already work#
A held payout should be understandable from the main payment operations view without switching tools. On each affected record, expose policy state, payout state, hold timing, current owner, hold reason, release outcome, and any relevant market, program, or contract qualifier.
That qualifier matters because one blended hold metric can hide where the issue actually sits. Sample held records and confirm the screen answers three questions right away: what is blocked, who owns the next action, and what must happen next.
Split policy blocks from rail failures#
Use explicit labels even when providers use different status names. In this workflow, "blocked by policy" can mean the payout is paused by review or rules, while "failed by rail" can mean execution was attempted and failed.
If both are collapsed into one failure bucket, teams can take the wrong action and retry pressure can grow while review queues stay unresolved. Track retry volume against unresolved policy-blocked volume to catch that mismatch early.
Track aging and release outcomes. Compliance holds need the same queue discipline as any other exception path: track open time, aging, and final outcome. Include whether a case was released, rejected, or returned for revision, since incomplete submissions may be returned instead of cleared.
Keep a compact evidence trail on the payment or payout record so delayed settlements can be diagnosed later. Watch for silent backlog growth by pairing aging with release outcomes, not just top-line queue counts.
Qualify metrics by market or program. Keep gate behavior qualified by market, program, or contract category so category-specific rules stay category-specific. Oregon's 2025 CCO questionnaire illustrates the pattern. Targets were tied to contract categories, including 70% in HCP-LAN category 2C or higher and 25% in HCP-LAN category 3B or higher, with submission due May 2, 2025.
Treat those figures as program-specific, not universal defaults. Keep security risk visibility in the same operations view as well, since events like data breaches, identity theft, and ransomware attacks can disrupt payment processing and trust.
Step 7 validate reconciliation and settlement daily#
After policy holds are visible, run a daily proof that posted activity, settlement activity, and bank cash still tie out. Without this checkpoint, dashboards can stay green while ledger lines, provider references, and bank matches drift.
Run the close checkpoint from the ledger outward#
Start from posted records, then confirm received funds against the corresponding bank statements. Use one repeatable checklist:
| Checkpoint | What to confirm |
|---|---|
| Unmatched ledger lines | Count unmatched ledger lines by break type, not as one blended total |
| Provider references vs amount mismatches | Separate unresolved provider references from true amount mismatches |
| Open break aging | Review aging for open breaks so older items are handled before period close |
| Bank cash vs settlement | Verify deposited bank cash against expected settlement activity, including receivables that should be offset |
Keep statuses standardized. If exception signals are unclear, teams cannot quickly tell whether the issue is a missing reference, delayed settlement, or posting defect. Manual work expands when those states blur together.
Make settlement signals prove themselves#
Treat ledger outcomes and bank-match status as the source of truth. If you run end-of-day settlements, reconcile settlement totals to the ledger first.
Do not leave Settlement health marked green when ledger breaks or unresolved bank matches remain. If aggregate reporting conflicts with raw reconciliation status, mark the rollup degraded until the discrepancy is explained. This discipline matters even more across many providers, where exception complexity rises quickly.
Test 835 remittance data before adding it to daily controls#
For healthcare-like flows, validate 835 remittance data before making it part of close-critical matching. These operations can involve multiple parties, delayed settlements, and added reconciliation overhead, so extra fields may help or may add late or hard-to-join references.
Run a controlled sample: current matching method versus matching with 835 fields added. Keep 835 in the daily control path only if it improves hard-case handling and arrives in time for close. Otherwise, keep it for investigation and root-cause support.
Publish one close-readiness status#
Publish one daily close-readiness update with a single owner and a short exception summary. The point is one clear operational answer: close-ready or not, what is still open, who owns next action, and what could still move reported numbers.
Keep it brief: readiness state, material break count, oldest open item, any bank-match variance, and next decision time. If ownership cannot be named clearly, treat that as a reconciliation control gap.
Common failure patterns and how to recover fast#
Once daily close-readiness is in place, focus on containment speed. Payments risk cannot be fully eliminated, and platform exposure often spans credit risk, fraud risk, and account takeovers. Treat failures as expected operating conditions: alert on symptoms first, then use diagnostics to find causes.
Contain duplicate state changes before cleanup. If you see duplicate transitions, contain the impact first by pausing affected automated writes while you verify what changed. Start with a direct check of ledger outcomes, settlement status, and customer-visible state for the impacted IDs.
Then decide recovery based on evidence. Controlled replay from a known-good point can be one option, but it is not always the right action; run reconciliation checks before normal processing resumes.
Mark webhook-driven gaps as degraded until recovery is verified. Delayed Webhooks can hide missing data behind normal-looking dashboards. Mark impacted metrics as degraded immediately, and keep that state until the missing window is recovered and verified.
If your provider supports export or read access, those can help rebuild the gap and compare expected versus ingested references for that interval. Choose the backfill path based on your system controls and runbook.
Split payout delay by rail, provider, and corridor. When payout delays appear, avoid one blended delay metric. Break performance out by rail and provider, then by corridor or segment, so you can prioritize the highest-impact lane first. Track recovery at the lane level, not just portfolio averages, because aggregate improvements can hide unresolved backlog in a single lane.
Audit routing when policy state changes affect ownership. If queue ownership depends on policy state, audit whether policy-state changes and queue assignments still match. On stalled items, compare current policy state, assignment, and next required action before retrying execution.
Keep a short case record for handoff clarity. If ownership is unclear, resolve ownership before resuming operational retries.
Conclusion and copy paste launch checklist#
Do not launch until ownership, KPI definitions, telemetry, and escalation paths are clear enough for operators to act without guesswork. Use this checklist before rollout:
- Define your operational layers and assign one accountable owner per layer.
Make ownership explicit. For any widget, the team should be able to answer who owns it, what changed, and what action comes next.
- Publish a KPI dictionary before go-live.
Put KPI definitions in a shared doc. For each KPI, include formula and source data where applicable, plus refresh cadence and escalation target, so different operators can reproduce the same result.
- Connect telemetry before rollout, and track retries as a separate signal.
Keep key behavior visible in one operational view so retries do not distort interpretation. If you provision alerts in Grafana via API, validate payloads carefully because provisioning JSON differs from export JSON.
- Expose policy and processing states in the same operational view.
Keep those states visible alongside status signals so operators can quickly separate policy blocks from processing failures and route work to the right queue.
- Run recurring checks and trend exception patterns until stable.
Choose a cadence that matches your operating rhythm, then track unresolved items, aging, and owner assignment consistently so exceptions do not accumulate unnoticed.
- Review dashboard usefulness early and remove anything that does not drive a decision.
Keep widgets intentional: each one should support a clear decision or escalation path. This also helps prevent dashboard sprawl. Some platforms enforce hard limits, for example, Qualtrics limits most EX projects to 15 dashboards and pulse projects to 8, and create or copy is disabled at the cap.
If any checklist item fails, delay launch and close the gap first. When your launch checklist is defined, confirm coverage and control fit for your flow with your team: talk to Gruv.
Frequently Asked Questions
What is a payment health dashboard for platforms?
A payment health dashboard for platforms is a visual command center for key financial and operational metrics. One documented implementation is split into two layers: aggregate Payment Analytics and transaction-level Payment Details. That structure lets teams monitor trends and investigate individual successful and failed payments in the same flow.
Which metrics are mandatory before scaling payouts?
There is no universal mandatory KPI list or threshold in the provided sources. A practical baseline is visibility into both aggregate metrics and transaction-level records, including failed and successful payments, so teams can act instead of only observe.
How is payment health different from billing analytics?
There is no universal definition in these sources that cleanly separates payment health from billing analytics across all platforms. In the referenced model, the operational distinction is that Payment Details supports investigation of successful and failed transactions, while summary views track aggregate performance. Relying on a successful-only Payments Report can hide failure patterns.
How do you map payment failures to owner actions?
Map failures to concrete next actions in the transaction view, such as resend, void, refund, or mark paid. For handoffs and review, export raw Payment Details in .csv, .xlsx, or .json so teams are working from the same record set.
Which dashboard KPIs are vanity metrics for finance ops teams?
A KPI is vanity when it does not drive a decision or action. One source’s guidance is to track the right things, not everything, and adoption is a hard test: if teams do not use the dashboard, it has low operational value. Also verify time filters before reacting, since one documented dashboard defaults to the previous month until filtered.
How often should payment health metrics refresh?
No fixed refresh SLA is provided in the grounding pack. In these sources, cadence is unspecified, so check data freshness before interpreting results.
How do idempotency and retries affect dashboard truth?
The grounding pack does not define a quantified method for measuring idempotency or retry effects on dashboard accuracy. When results look inconsistent, validate at the transaction level using records that include both successful and failed payments, and avoid relying on successful-only reports as your only health signal.
Try a related tool
Researched and edited by the Gruv editorial team. Gruv builds cross-border billing, payouts, and finance-operations software for global businesses.
Sources
Includes 2 external sources outside the trusted-domain allowlist.
- floridahealth.gov/wp-content/uploads/2025/08/20230307-PHIC-Not...trusted
- hcpf.colorado.gov/sites/hcpf/files/Truven%20-%20BIDM%20Contrac...trusted
- oregon.gov/oha/HPA/dsi-tc/VBPReports/Trillium-TriCounty...trusted
- pmc.ncbi.nlm.nih.gov/articles/PMC8928055trusted
- pmc.ncbi.nlm.nih.gov/articles/PMC8590973trusted
- sloanreview.mit.edu/projects/the-future-of-strategic-measurement...trusted
- bill.com/blog/accounts-payable-process-flow-chartexternal
- blog.servicedirect.com/affiliate-insights-platform-health-dashboardexternal
Educational content only. Not legal, tax, or financial advice.
Related Posts

The Freelance Payment Penalty: A Modeled Audit of Platform Fees, FX Spreads, and Payout Delays
The money rarely disappears through a single, easy-to-spot fee. The real loss is stacked. A marketplace takes its commission, a processor adds a charge for international cards, a bank or payment company converts the currency at a spread, a platform holds the funds before release, and a wire sheds a little to intermediaries on the way in. Each layer looks defensible on its own, but the worker feels the combined result as a smaller deposit and a later payday.

How to Respond to a Subpoena for Business Records
Move fast, but do not produce records on instinct. If you need to **respond to a subpoena for business records**, your immediate job is to control deadlines, preserve records, and make any later production defensible.

A US Expat's Guide to Investing in UCITS ETFs to Avoid PFIC Issues
The real problem is a two-system conflict. U.S. tax treatment can punish the wrong fund choice, while local product-access constraints can block the funds you want to buy in the first place. For **us expat ucits etfs**, the practical question is not "Which product is best?" It is "What can I access, report, and keep doing every year without guessing?" Use this four-part filter before any trade: