
Quick Answer
Build the AP automation business case with transparent ROI math and verified baseline data. Start by mapping your current AP flow, measuring cost per invoice, cycle time, exception rate, STP rate, and fully loaded labor cost, then calculate Net Annual Savings as total savings minus ongoing costs and ROI as Net Annual Savings divided by Total Initial Investment. Separate one-time from recurring costs, label assumptions, and pressure-test conservative, expected, and aggressive scenarios.
How to Build the Business Case With an AP Automation ROI Calculator#
If you need a CFO-ready case for AP automation, start with transparent math and explicit assumptions. A defensible model is more useful than a bigger headline ROI claim.
Before you start#
Step 1. Set the proof standard
A useful AP automation business case is a finance case, not a demo estimate dropped into a spreadsheet. The core formula is straightforward: ROI = Net Annual Savings / Total Initial Investment, where Net Annual Savings means total savings minus ongoing costs. Trust usually breaks on hidden assumptions about labor, exceptions, implementation effort, and control risk.
For platform operators, those gaps can get expensive quickly. Manual AP can slow scale, increase operating risk, and consume time your team should spend on higher-value work. If your process includes multi-entity approvals, payout dependencies, or cross-border review, a generic calculator can miss meaningful cost unless you add those layers directly.
Step 2. Aim the model at platform reality
This guide is for platform finance operations, not a simple back-office AP queue. Your case should reflect the checkpoints that drive real effort, including invoice matching and approval, plus the internal controls that help defend against fraud and human error.
Set one boundary rule early: if your current state spans multiple entities or downstream payout operations, do not present the model as "just AP" unless the exclusions are explicit. You can run an AP-only case, but label what is out of scope so projected savings are not overstated from the start.
Set one evidence rule too: baseline inputs should be verifiable from source data. At minimum, identify your current Straight-Through Processing (STP) Rate, the fully-loaded cost of labor behind manual work, and where exceptions appear between invoice intake and approval. If any input is estimated, mark it as an assumption.
Step 3. Build for approval, not just analysis
The goal is a model a finance leader can review quickly without black-box logic. Keep each major benefit bucket inspectable, separate one-time from ongoing costs, and assign an owner for each major claim.
By the end of this article, you should have three outputs: a transparent model structure, practical decision thresholds, and an implementation checkpoint list tied to execution risk. One warning before you get into the numbers: many teams overfocus on invoice speed and underweight rollout drag, approval complexity, and control or compliance risk across entities.
What to prepare before you open any AP automation ROI calculator#
Before you model savings, build a small evidence pack. A reliable AP ROI case starts with baseline volume, labor cost, exception behavior, clear ownership, and explicit scope.
| Preparation step | What to gather or decide | Checkpoint |
|---|---|---|
| Pull AP volume and labor baseline data | A representative AP activity period, invoice throughput, how many staff are dedicated to AP work, the true Fully-Loaded Cost of labor, current AP expenditure, and hidden losses tied to AP errors | Every core input ties back to source records or is labeled as an assumption |
| Build evidence from actual workflow stages | Visible counts, step transitions, and where exceptions enter | Document the end-to-end step count and confirm visibility into each stage |
| Assign assumption owners | Who owns each major assumption and who validates outcomes after launch | Define a sign-off path early |
| Lock scope | Whether this is an AP-only case or a broader operations case, plus what is included and excluded | Keep scope boundaries in writing so Net Annual Savings and Total Initial Investment reflect the same boundary |
Step 1. Pull AP volume and labor baseline data#
Start with a representative period of AP activity and capture invoice throughput across day, week, month, and year views if you have them. Include how many staff are dedicated to AP work and use the true Fully-Loaded Cost of labor, not salary alone.
Checkpoint: every core input should tie back to source records. If it cannot, label it as an assumption. Include current AP expenditure and any hidden losses tied to AP errors, not just visible operating costs.
Step 2. Build evidence from your actual workflow stages#
Pull reports from the stages your team actually runs. You need visible counts, step transitions, and where exceptions enter.
Checkpoint: document the end-to-end step count and confirm visibility into each stage. If you cannot show where invoices stall or branch, keep savings estimates directional until the process baseline is cleaner.
Step 3. Assign assumption owners before modeling savings#
If no one owns the assumptions, the model can stall in review. Name who owns each major assumption and who validates outcomes after launch.
Checkpoint: define a sign-off path early. Without stakeholder buy-in, the business case often stalls before vendor evaluation.
Step 4. Lock scope before counting benefits#
Scope drift can overstate ROI. Decide whether this is an AP-only case or a broader operations case, and state what is included and excluded.
Checkpoint: keep scope boundaries in writing so Net Annual Savings and Total Initial Investment reflect the same boundary from the start.
If you want a deeper dive, read Accounts Payable Automation ROI: How Platforms Calculate the Business Case for Payables Technology.
Map your current AP flow and cost baseline#
Your ROI model is only as credible as your baseline, so map the real AP flow before you model savings.
Step 1 Trace the live invoice path#
Map the process from Invoice capture through Archiving and reporting, including intake channels, PO matching where applicable, approval routing and follow-up delays, payment release, and filing for audit and finance reporting. Document what actually happens, not just the intended process, so branches, stalls, and manual interventions stay visible.
For each stage, tag handoffs, queue time, and manual touchpoints. If helpful, use a simple table with stage, owner, entry trigger, exit trigger, source record, and common exception reason.
Checkpoint: each handoff should tie to an inspectable record, for example approval logs, inbox trails, ERP exports, or payment status records.
Step 2 Measure the baseline KPIs#
Use specific KPIs, not rough estimates, to quantify current performance. Common baseline KPIs include cost per invoice, cycle time, exception rate, duplicate or error rate, and Straight-Through Processing (STP) Rate. Keep the measurement period consistent across KPIs so comparisons hold.
| KPI | What to count | Verification detail |
|---|---|---|
| Cost per invoice | Total AP processing cost / invoice volume | Use the same time period for both values |
| Cycle time | Time from receipt to ready-to-pay or posted state, per your scope | Use system timestamps, not estimates |
| Exception rate | Share of invoices leaving the standard path | Keep one fixed exception definition |
| Duplicate/error rate | Duplicate or error cases that require correction | Reconcile to issue logs or audit records |
| STP rate | Share of invoices processed without extra manual handling | Lock numerator and denominator before scenario comparisons |
If you do not yet have internal cost-per-invoice data, vendor benchmarks can be a directional check only: $10.18 per invoice for manual processing versus $3.12 per invoice for best-in-class automated processing. Use your own data for the business case.
Step 3 Price labor and non-labor losses#
Labor savings usually carry the case, but documented non-labor losses still matter. Convert process activity into cost by splitting labor by role and applying the Fully-Loaded Cost of labor. Separate invoice processors, approvers, and escalation or rework owners instead of defaulting to one blended labor rate.
Then isolate non-labor losses you can document, such as missed early-payment discounts and rework. The source material notes potential 1-2% early-payment discounts, but include that in core savings only if your records show eligibility and misses. Otherwise keep it as a scenario input.
Checkpoint: keep lower-confidence items separate when the cost cannot be tied to a document trail.
Step 4 Add control and compliance friction#
Control work should show up in the baseline as its own effort, not as a vague overhead line. Internal AP controls are intended to reduce fraud and human-error risk; baseline the time and effort those controls require.
If additional compliance reviews touch your AP flow, mark them as separate gates with owner, queue time, and output artifact, for example a review record, documentation request, or archived evidence. Focus on measurable friction rather than assuming automatic compliance savings.
We covered this in detail in How to Scale Your Finance Team Without Hiring: The Platform Operator Automation Playbook.
Build the ROI model finance and product can both defend#
A defensible model is one reviewers can trace line by line. If a stakeholder cannot tie an input to an internal record, external benchmark, or vendor document, keep it out of the base case or label it as directional.
Step 1 Expose the math in plain sight#
Show the core formulas and the source for each input next to them:
Annual Invoice Volume = Monthly Invoice Volume ×12Net Annual Savings = Total Savings - Ongoing CostsROI = Net Annual Savings / Total Initial Investment
This structure keeps recurring operating costs inside Net Annual Savings and one-time spend in Total Initial Investment. Avoid hidden-formula calculators. If reviewers cannot see and adjust assumptions, the model is harder to approve.
Checkpoint: each formula input should map to one evidence source, for example ERP exports, approval or queue timestamps, or signed pricing terms.
Step 2 Separate one-time implementation from recurring run costs#
A common review failure mode is mixing cost categories. Keep one-time implementation costs in Total Initial Investment, and keep recurring charges in ongoing costs. At minimum, split implementation, support, and Optical Character Recognition (OCR) costs cleanly.
| Cost line | Place in model | Note |
|---|---|---|
| Implementation | Total Initial Investment | Keep one-time implementation costs here |
| Support | Ongoing costs | If implementation and first-year support are bundled in one quote, split them before presenting ROI |
| Optical Character Recognition (OCR) costs | Ongoing costs | If pricing changes with invoice volume, model it as a recurring cost tied to annualized volume |
If OCR pricing changes with invoice volume, tie it to annualized volume, and split any bundled implementation and first-year support before you present ROI.
Failure mode to avoid: mixing categories. Double-counting recurring costs understates returns, while omitting them overstates returns.
Step 3 Build benefits as auditable buckets#
Use separate, reviewable benefit buckets instead of one blended savings line:
- Labor savings, tied to reduced touches or time and fully loaded labor cost
- Discount capture, only when eligible terms and missed-discount history are documented
- Avoided duplicate payments, backed by incidents, audits, or recovery records
- Reduced exception handling, using the same exception definition as your baseline
If the value is capacity released rather than direct cash savings, label it that way so finance can classify it correctly. Also avoid overlap. If exception work is already inside total labor time, carve it out before booking it as a separate benefit.
Step 4 Add an assumption audit table with confidence labels#
External benchmarks help when internal data is thin, but keep them visible as benchmarks rather than presenting them as internal proof. Label confidence explicitly, including when you use industry or vendor benchmark claims.
| Model line | Basis used in model | Source type | Confidence | Evidence or checkpoint |
|---|---|---|---|---|
| Annual invoice volume | 12-month average monthly volume ×12 | Internal logs | High | ERP or AP export for the full period |
| Labor minutes saved per invoice | Current touch-time vs expected post-automation handling | Internal logs | High | Queue timestamps, user activity, approval logs |
| OCR run cost | Per-document or subscription charge tied to annualized volume | Vendor contract or quote | Medium if contracted, Low if marketing-only | Pricing sheet, order form, or negotiated terms |
| Discount capture uplift | Expected improvement where internal miss data is incomplete | External benchmark or vendor claim | Medium to Low | Mark as directional; move to scenario case if unsupported |
| Duplicate-payment reduction | Historical duplicate incidents plus expected prevention rate | Internal logs, sometimes vendor claim | Medium | Audit findings, incident logs, recovery records |
| Exception handling reduction | Baseline exception rate and handling effort adjusted for expected STP change | Internal logs | High | Exception queue report using the same baseline definition |
Base case recommendation: rely on high-confidence internal inputs first. Use external benchmarks to set scenario ranges and pressure-test assumptions, with confidence labels visible to both finance and product.
Related reading: Accounts Payable KPIs: The 15 Metrics Every Payment Platform Finance Team Should Track.
Pressure-test assumptions with scenario bands and decision thresholds#
Once the base case is traceable, test whether it still holds under normal rollout friction. Your recommendation should not depend on one optimistic Straight-Through Processing (STP) Rate assumption or a flawless launch month.
Step 1 Model three scenarios around the inputs most likely to move#
Use the same formula structure for Net Annual Savings and Total Initial Investment, then vary only STP Rate, exception rate, and implementation ramp time.
| Scenario | STP and exception assumption | Ramp-time assumption | Use |
|---|---|---|---|
| Conservative | Smaller STP gain, slower exception improvement | Delayed adoption and stabilization | Downside resilience test |
| Expected | Improvement supported by your current process evidence | Realistic rollout with normal friction | Primary decision case |
| Aggressive | Faster STP lift, cleaner exception outcomes | Faster adoption with minimal rework | Upside reference only |
Before running scenarios, validate data freshness, reconcile discrepancies, and tag lineage for each changed assumption so the outputs stay auditable.
Step 2 Set go, pilot, and defer rules before reading results#
Set the decision rules before you look at the outputs. If the expected case misses your internal payback target, or the conservative case creates downside finance will not absorb, run a limited pilot before full rollout.
Keep the pilot narrow enough to isolate the variable being tested, and require auditable outputs, for example exception tickets, approvals, and logs, so the result is decision-ready rather than demo-ready.
Step 3 Add break-even sensitivity for volume and complexity#
Volume and approval complexity can move materially, so test both. Show how results change if invoice volume stays flat or if approval paths stay complex longer than planned.
Also separate benefits that scale directly with volume from benefits that may remain capacity release. That keeps finance and product aligned on what is immediate cash impact versus operational headroom.
Step 4 Increase downside weight when AP affects global seller payouts#
If AP feeds global seller disbursements, consider treating Payout batches and policy-gated disbursements as a separate risk layer in your scenarios. In that context, ramp delays, exception leakage, and approval-routing issues can warrant more downside weight.
Also pressure-test automation stability when interfaces or schemas change. Where controls are weaker, lower confidence in the expected case and earn rollout scope through pilot evidence, including segregation-of-duties routing and immutable audit trails.
Add platform-specific cost and risk drivers competitors skip#
For a platform business, the model is incomplete if it stops at invoice capture and approval. If your reconciliation load or document burden is high, auditability, controls, and exception visibility can matter as much as sticker price.
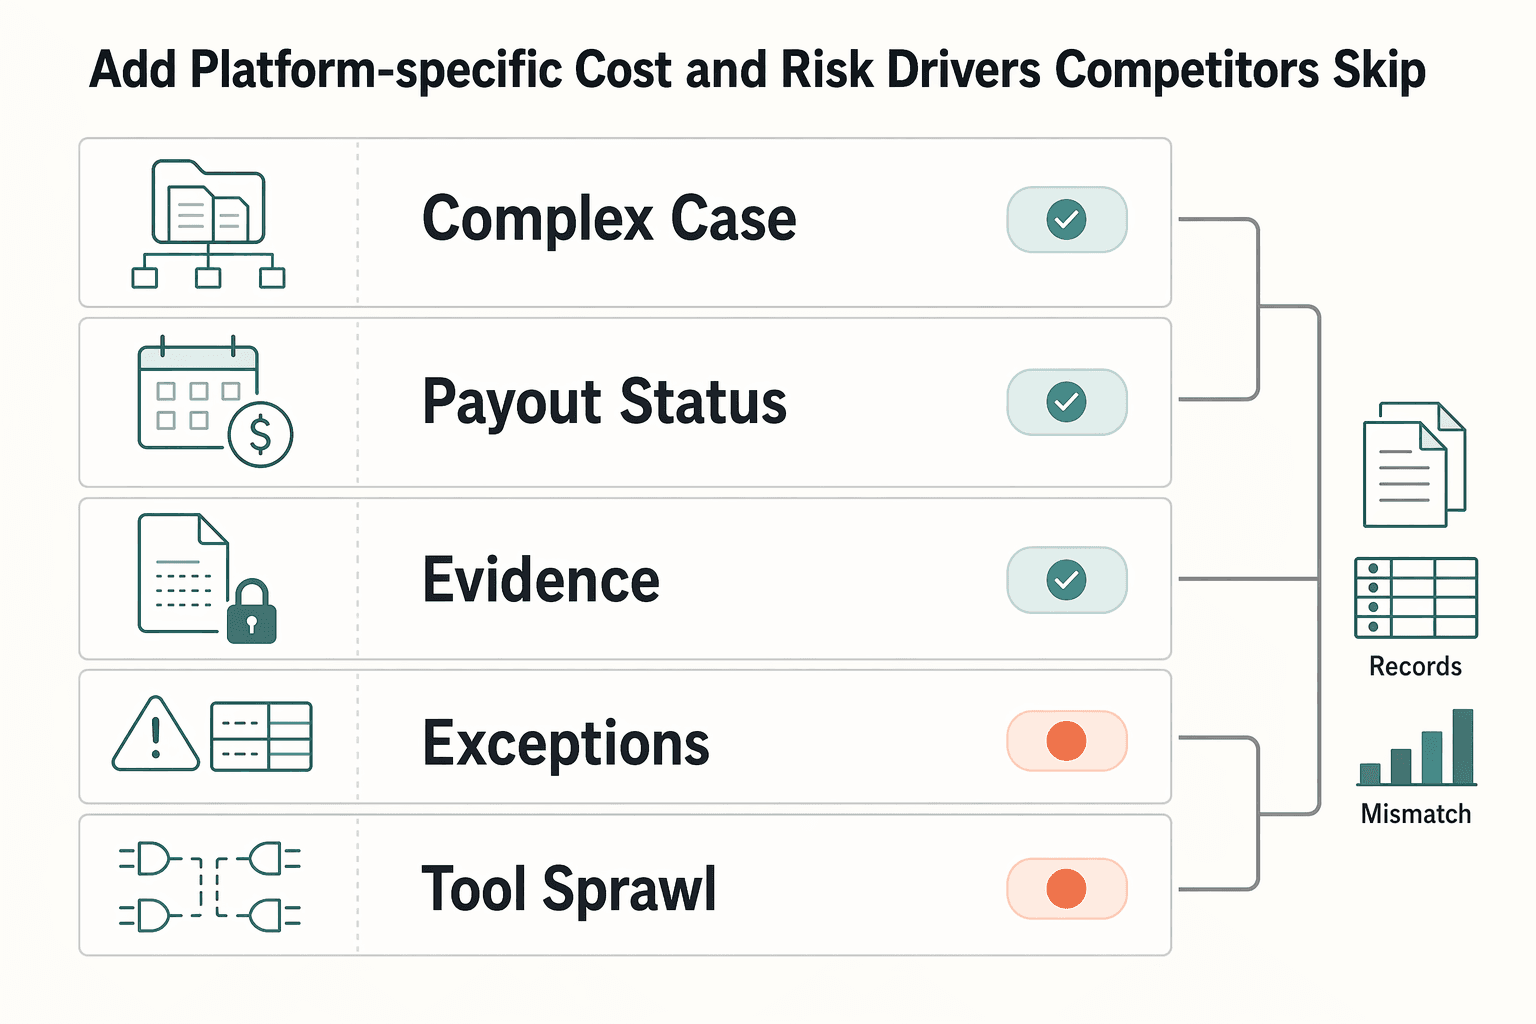
| Driver | What to include | Verification |
|---|---|---|
| Multi-entity reconciliation | Record matching across entities and systems in a multi-entity, multi-ERP setup | Map the invoice path from receipt through payment for representative entities |
| Payout-status follow-up | Post-approval status checks and adjacent work beyond invoice handling | Mark post-approval status checks in the mapped flow |
| Document linkage and audit trail | Collection, review, linkage to the correct vendor record, retention, retrieval, and audit-trail export | Confirm you can produce the source document, approval record, linked vendor record, and export trail without manual reconstruction |
| AP exceptions | Flagged discrepancies, such as PO mismatches, as a distinct exception queue | Tie each exception to a clear record without spreadsheet stitching |
| Tool sprawl and weak visibility | Extra connectors, manual reconciliations, and off-platform retrieval as recurring cost and control exposure | Verify post-launch with dashboards for cost per invoice, average processing time, and an exception-backlog metric |
Step 1 Extend scope beyond invoice handling#
Add the adjacent work that still consumes finance capacity: multi-entity reconciliation, payout-status follow-up, and exception handling. Otherwise, savings can look strong inside AP while effort shifts to finance ops.
If you run a multi-entity, multi-ERP setup, explicitly model record matching across entities and systems. Treat broad integration claims, for example 50+ ERP integrations, as a starting point, then test your actual entity stack. Also flag single-ERP coupling as a switching-risk note, since AP tooling may need replacement if your ERP changes.
Verification checkpoint: map the invoice path from receipt through payment for representative entities, then mark manual handoffs, reconciliation points, and post-approval status checks.
Step 2 Add document-linkage and audit-trail work where needed#
Model document operations explicitly, not as a generic buffer. Include collection, review, linkage to the correct vendor record, retention, retrieval, and audit-trail export.
Keep the proof practical: confirm you can produce the source document, approval record, linked vendor record, and export trail without manual reconstruction. If invoice extraction is automated but linkage is weak, work can shift into exception handling.
Step 3 Separate AP exceptions from straight-through flow#
Treat flagged discrepancies, such as PO mismatches, as a distinct exception queue instead of burying them in a single exception-rate assumption. Even when invoice entry gets faster, exception resolution can remain a meaningful workload.
Use a simple checkpoint: can each exception be tied to a clear record without spreadsheet stitching? If not, include that as ongoing operating cost and control risk in the business case.
Step 4 Penalize tool sprawl and weak visibility#
Fragmented tooling is a real cost driver, and it belongs in the model. Point-solution sprawl is associated with disconnected data and redundant integrations, and one reported benchmark notes 6 to 9 AI-enabled tools in 2026 with potential overlap and maintenance costs of $40,000 to $120,000 annually for mid-market teams. Use that as a risk signal, not a default line item.
In your recommendation, treat extra connectors, manual reconciliations, and off-platform retrieval as recurring cost and control exposure. Then verify post-launch with dashboards for cost per invoice, average processing time, and an exception-backlog metric.
Compare AP platforms with an evidence scorecard#
A good comparison starts with the same test for every vendor. Use one scorecard, one demo script, and one evidence request list across your shortlist. If a vendor cannot prove fit on your documents, approvals, and exports, do not let a polished ROI story decide the purchase.
Step 1 Set the same weighted criteria before any demo#
Freeze criteria and weights first so the comparison stays repeatable under CFO and procurement review. Start from the same 3 baselines for every vendor: per-invoice processing cost, manual error rate, and AP exception-handling hours. Then score each vendor on the same 6 weighted criteria.
| Weighted criterion | What you are testing | Evidence to request |
|---|---|---|
| Extraction accuracy | Whether invoice fields are captured correctly on your real document mix | Sample output on your invoices, plus visible error handling |
| Format and language support | Whether your current invoice formats work without manual rekeying | Test results on representative formats from your entities |
| Integration depth | How deeply the product connects to your ERP or accounting stack | Integration map, sample export, and implementation dependencies |
| Deployment model fit | Whether architecture matches your constraints, for example SaaS vs API | Architecture overview and admin model |
| Pricing transparency | Whether implementation, volume, and support costs are explicit | Pricing sheet with assumptions and exclusions |
| Security posture | Whether access, logs, and audit evidence meet control needs | Audit trail demo and security documentation |
A practical guardrail: keep vendor names out of the template until weights are locked.
Step 2 Force proof of operational fit#
Require the same proof set from each vendor: configurability, approval policy support, exception handling, and export quality for close and audit. The goal is to test real operating conditions, not a clean demo path.
Use a representative AP sample, then require the artifacts finance will need later: approval history, exception status, linked invoice record, and export output. If your team would still need spreadsheet stitching or manual reconstruction, score that as control and labor risk.
Adoption risk belongs in the scorecard too. Implementations often underperform when AP teams resist change.
Step 3 Check adjacent stack impact before pricing savings#
Treat AP selection as part of your broader finance stack, not an isolated tool choice. Test whether exports, dimensions, timestamps, and entity references fit your close process and reconciliation needs.
If your team reports under IFRS 15 or ASC 606, have your accounting owner confirm the exported records support your current review steps. Do not assume alignment from vendor positioning alone.
Also separate external benchmarks from internal proof. STP, accuracy, and savings figures can be vendor-reported or vendor-cited, so validate them against your own baseline.
Step 4 Reject black-box ROI claims#
Only accept calculator outputs you can trace back to assumptions, formulas, and data lineage. If a savings line cannot be tied to your baseline, your adoption ramp, and stated implementation scope, keep it out of the business case.
Use the scorecard to separate evidence from sales math. If a vendor will not show how STP improvement, implementation effort, or total cost of ownership was derived, score that response down in the final recommendation.
For a step-by-step walkthrough, see AP Automation ROI for Platforms That Need a Defensible Business Case.
If payout reliability and batch visibility are part of your scorecard, review how Gruv Payouts supports status tracking and policy-gated disbursements where enabled.
Plan implementation phases and verification checkpoints#
Rollout quality strongly affects ROI. Phase the implementation, set clear checkpoints in each phase, and move forward only when live-process evidence supports the next step.
Step 1 Split rollout into practical phases with clear checkpoints#
Use a phased structure so each stage has one objective, a small KPI set, and a review pack finance can validate.
| Phase | Primary objective | What to verify before moving on |
|---|---|---|
| Setup | Configure OCR, approval workflows, and core process routing | Approval workflows send invoices to the right approvers at each stage; OCR capture reduces manual entry errors on your document mix |
| Controlled launch | Run limited live volume | Invoice processing time and error rate can be compared to baseline with traceable records |
| Optimization | Resolve issues found in live use | Integration gaps, data-quality issues, and related rollout obstacles are being reduced through defined fixes |
| Steady-state measurement | Confirm results hold over time | Regular KPI review continues and process performance remains stable enough to support ROI tracking |
Keep KPI expectations directional unless your own baseline already supports specific thresholds.
Step 2 Verify control integrity before scaling live volume#
Do not scale a shaky process. Before you expand, confirm stage-by-stage sign-off is working as designed. If approval routing is inconsistent or OCR capture still creates frequent correction work, pause and fix those issues before counting projected savings.
Step 3 Run controlled launch with evidence finance can defend#
Start with a limited invoice slice and compare performance against your baseline for processing time and error rate. Keep a consistent review pack with traceable records that finance can validate.
Step 4 Test risk paths explicitly#
The standard path is not enough. Validate how the rollout handles known risk areas before expanding.
AP automation rollouts often stall on integration gaps, data quality issues, internal resistance, and fraud risk. A risk-aware rollout anticipates those obstacles early and builds the foundation to address them before broader scale.
Common business-case failure modes and how to recover#
After a pilot, the weak point is often the ROI model, not the software itself. Common failure drivers also include process and technical complexity, talent gaps, and siloed initiatives. If the case looks too clean, check for omitted value categories or assumptions that are too loosely defined for finance review.
Step 1 Reconcile every benefit bucket to one owner and one metric#
Labor-only ROI views are incomplete. If reduced manual effort is counted in fully loaded labor cost savings, keep that benefit in one bucket rather than repeating it elsewhere.
Use one owner, one metric, and one system record for each benefit line. If a line cannot be tied to process mapping, error-rework cost, or delay-impact evidence, remove it or mark it low confidence.
Step 2 Replace generic benchmark ranges with internal AP evidence#
Benchmarks are useful for a draft, not a final model. Published payback ranges conflict, and your AP process complexity may not match the sample behind those numbers.
Recalibrate from your own flow, from invoice intake through approval. Add confidence bands where assumptions still rely on external inputs, and make internal versus external inputs explicit in the assumption table.
Step 3 Reforecast Total Initial Investment when implementation drag appears#
Implementation drag often appears only after detailed process mapping. If mapping reveals complex approval paths, update the model immediately rather than waiting for post-launch misses.
Reforecast Total Initial Investment, stage scope where needed, and reset payback expectations with leadership early so trust in the business case stays intact.
Step 4 Write the controls case as carefully as the savings case#
A weak controls narrative can undermine an otherwise solid ROI case. Document how vendor verification, approval hierarchies, and audit trails reduce risk and strengthen governance through enforceable internal controls.
Include evidence finance can defend: approval history and audit-trail artifacts used for auditor or regulator review. This reframes the case from only time savings to lower risk with cleaner proof.
Related: How to Make the Case for AP Automation to Your CFO: A Platform Finance Team Playbook.
Present to CFO in one review cycle#
Aim to reduce decision friction, not add more analysis. A CFO review is typically easier when one pack shows the baseline, the ROI math, the key uncertainties, and how results will be verified after launch.
Step 1 Assemble one decision pack#
Use one document or deck with linked backup, not separate files. Include the baseline table, ROI model, scenario outputs, assumption audit log, and implementation checkpoint plan.
Make the formula page explicit: Cost per invoice = Total AP labor cost / Annual invoice volume. Then show how that baseline flows into Net Annual Savings, which is total savings minus ongoing costs, Total Initial Investment, and AP automation ROI, which is Net Annual Savings / Total Initial Investment.
Label assumption confidence clearly. If an input comes from internal records, mark it as internal evidence. If it comes from external estimates, mark it as external.
Step 2 Keep the decision narrative to one page#
Keep the narrative short enough to read in one sitting. Lead with the business objective and quantified impact, then list the main risks and mitigation owners. Keep this page focused on decision logic, not feature detail.
Frame impact in operating terms finance can test: AP unit cost, exception handling, controls, and audit evidence. Tie each point back to the model, including Net Annual Savings.
Step 3 Add a clear decision matrix#
Finish with explicit next-action conditions so decisions are less likely to stall.
Use this matrix as a starting point, then adapt thresholds to your team:
| Decision path | Use it when | Required gaps or conditions |
|---|---|---|
| Proceed now | Baseline data is reliable, expected-case savings are credible, and implementation checkpoints have owners | Final scope, budget, and reporting cadence confirmed |
| Pilot first | Expected case is attractive, but one or more assumptions still have low confidence | Pilot scope, success metrics, and rollout trigger evidence defined |
| Defer | Major data gaps remain or Total Initial Investment is still too uncertain | Missing inputs, owners, and revisit date documented |
Step 4 Define a post-launch measurement cadence#
Use a 30-60-90 cadence if it fits your rollout. At 30 days, confirm implementation progress and data quality. At 60 days, review KPIs such as cost per invoice, exception rate, and Straight-Through Processing (STP) Rate. At 90 days, reconcile actuals to the model and update Net Annual Savings.
Define proof sources and owners up front so post-launch variance is auditable and comparable to the original model assumptions.
You might also find this useful: How to Measure AP Automation ROI: A CFO's Framework for Payment Platform Finance Teams.
Conclusion#
The strongest AP automation business case is the one you can defend line by line, not the one with the biggest ROI claim.
- Confirm your AP baseline and owner first.
Anchor the model in current invoice and payment processing costs. At minimum, align on cost per invoice, cycle time, and Straight-Through Processing (STP) Rate from consistent source systems.
- Use transparent ROI math.
Show formulas and inputs finance can inspect, such as ROI (%) = [(total benefits - total costs) / total costs] x 100 or Net Annual Savings / Total Initial Investment, with clearly defined costs and benefits. Make each assumption traceable to internal records and documented inputs.
- Pressure-test scenarios before you commit.
Run conservative, expected, and aggressive cases by changing core drivers like STP rate, processing time, and cost assumptions. If the case only works under optimistic assumptions, treat it as directional, not decision-ready.
- Model operating complexity explicitly.
If your operating model spans multiple entities, compliance workflows, or added control gates, account for that work directly. Do not bury ongoing review and exception handling inside a generic overhead line.
- Evaluate vendors on evidence and controls, not headline savings.
Look for clear cost separation, one-time versus recurring, control design, auditability, exception handling, and implementation fit. A model that cannot show how value is created across the process is incomplete.
- Bring one decision pack with explicit thresholds.
Include baseline metrics, ROI model, scenarios, assumptions, top risks, and go, pilot, or defer criteria. Define post-launch verification metrics up front, including STP rate, cost per invoice, cycle time, and late-payment or missed-discount indicators.
Quick readiness test: baseline verified, math transparent, scenarios pressure-tested, operating complexity included, vendor evidence validated, and post-launch metrics assigned to owners. If one is missing, the case is not ready yet.
Before final CFO sign-off, validate coverage, controls, and reconciliation fit with your team's constraints through Gruv Contact.
Frequently Asked Questions
How do you calculate AP automation ROI for a finance team?
Calculate your current AP cost, then compare it with your future-state cost to estimate Net Annual Savings. Net Annual Savings equals total savings minus ongoing costs, and ROI equals Net Annual Savings divided by Total Initial Investment. Use internal volume data, fully loaded labor cost, and visible assumption sources so finance can review the model.
What belongs in an AP automation business case?
Include baseline metrics, explicit assumptions, benefit and cost buckets, risk controls, scenario outputs, and owners for post-launch verification. Tie projected gains to actual process checkpoints such as invoice capture, invoice matching and approval, and archiving and reporting. If a line item cannot be traced to source data or a specific process change, keep it low confidence.
What payback period is realistic?
There is no universal payback period for AP automation. Results depend on your operating context and how much manual work is actually removed. Use conservative and expected scenarios from your own model instead of adopting a benchmark as a commitment.
Which metrics matter most in AP automation?
Start with STP rate and the true fully loaded labor cost, then track control performance and human-error exposure over time. Measure them before and after launch with consistent source data. If one metric improves without better control outcomes, review for rework before claiming full ROI.
What do most ROI calculators miss?
Many calculators count direct processing savings but miss risk and compliance exposure, and they may overlook ongoing costs. They can also hide assumptions in black-box logic. Treat the output as directional until your team validates the inputs and ownership against internal records.
How should platform teams evaluate AP vendors?
Evaluate controls and reporting visibility before headline savings claims. Look for transparency on formulas, assumptions, approval controls, and reporting outputs. If the model does not clearly separate Total Initial Investment from recurring costs, treat the ROI claim as unproven.
Researched and edited by the Gruv editorial team. Gruv builds cross-border billing, payouts, and finance-operations software for global businesses.
Sources
Includes 4 external sources outside the trusted-domain allowlist.
- irs.gov/pub/irs-pdf/p5901.pdftrusted
- ppbereform.senate.gov/wp-content/uploads/2024/03/Commission-on-PPB...trusted
- sec.gov/Archives/edgar/data/1734722/0001734722240000...trusted
- stripe.com/resources/more/what-is-the-roi-of-ap-automat...trusted
- agenticstate.org/paper.htmlexternal
- cevinio.com/roi-of-ap-automation-steps-on-how-to-calcula...external
- chatfin.ai/blog/invoice-processing-tools-comparison-bes...external
- dokka.com/ap-automation-roi-calculatorexternal
Educational content only. Not legal, tax, or financial advice.
Related Posts

The Freelance Payment Penalty: A Modeled Audit of Platform Fees, FX Spreads, and Payout Delays
The money rarely disappears through a single, easy-to-spot fee. The real loss is stacked. A marketplace takes its commission, a processor adds a charge for international cards, a bank or payment company converts the currency at a spread, a platform holds the funds before release, and a wire sheds a little to intermediaries on the way in. Each layer looks defensible on its own, but the worker feels the combined result as a smaller deposit and a later payday.

How to Respond to a Subpoena for Business Records
Move fast, but do not produce records on instinct. If you need to **respond to a subpoena for business records**, your immediate job is to control deadlines, preserve records, and make any later production defensible.

A US Expat's Guide to Investing in UCITS ETFs to Avoid PFIC Issues
The real problem is a two-system conflict. U.S. tax treatment can punish the wrong fund choice, while local product-access constraints can block the funds you want to buy in the first place. For **us expat ucits etfs**, the practical question is not "Which product is best?" It is "What can I access, report, and keep doing every year without guessing?" Use this four-part filter before any trade: