
Quick Answer
Use an MRR buildup baseline and a separate churn stress view. Define new, expansion, contraction, and churn once across finance, ops, and product, then reconcile movement buckets from Stripe or Chargebee events to ledger journals before sign-off. Keep Expansion MRR separate from new business, track gross and net churn on the same monthly cadence, and apply dunning/payment-recovery adjustments only after core classification so recovered invoices are not mistaken for growth.
What to model in your subscription revenue forecast#
A usable forecast starts with shared definitions, not sharper formulas. If finance, ops, and product define MRR, Expansion MRR, or churn differently, the model can look precise and still fail the first serious review.
- Definitions first
Monthly Recurring Revenue (MRR) is the predictable recurring income generated from customers on a monthly basis. Forecast inputs get messy once you separate new revenue, expansion, contraction, and churn. Before you compare models, decide how Expansion MRR and churn are defined, and confirm that every team classifies recent account changes the same way.
- Pick the model for the question, not for style
There is no single universal method for subscription forecasting. Common approaches include cohort-based forecasting, driver-based forecasting, and the MRR Buildup Model, which breaks movement into new, expansion, churn, and contraction components. The right choice should match your stage, goals, and the planning question you need to answer.
- Use scenario cases when the business is moving
SaaS revenue moves with recurring payments, retention, expansion, contraction, and churn. That is why revenue planning usually works better with multiple cases, such as a base case plus stronger and weaker scenarios, than with one point estimate. A core monthly model tells you where the business stands. A stress case shows what happens if churn worsens or expansion slows.
The sections that follow focus on operating decisions across MRR, Expansion MRR, and churn. If your definitions are still unstable, start with the MRR Buildup Model to make movement categories explicit. If downside risk is rising, pair that baseline with a separate churn-focused scenario instead of relying on a single net view.
One practical recommendation up front: tie every forecast to inputs your teams can verify, and align on a shared definition set before review. A common failure mode is each department using the same words for different revenue movements until someone asks why the numbers do not match.
If your forecast depends on marketplace billing flows, read Building Subscription Revenue on a Marketplace Without Billing Gaps.
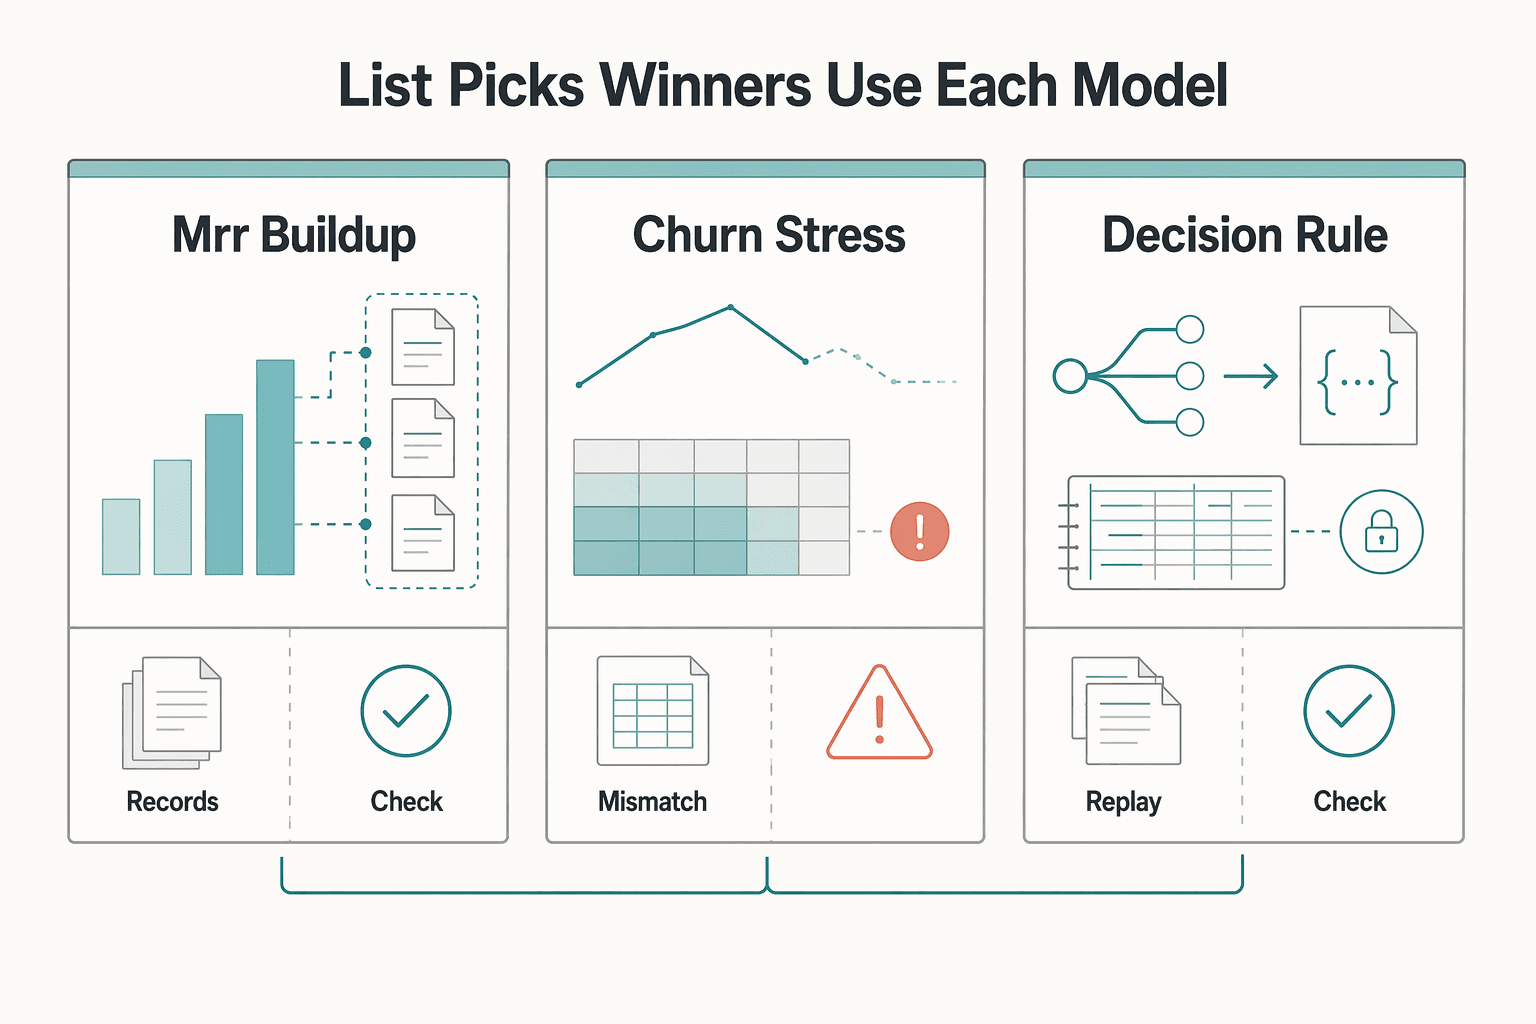
How this list picks winners and when to use each model#
The winners in this list are the models you can defend in review, not just present in a dashboard. The selection checks are definition clarity for Gross MRR churn vs Net MRR churn, reconciliation strength to ledger journals, and traceability to billing source events through webhooks.
For teams forecasting from Stripe or Chargebee, that evidence chain matters. Stripe delivers webhook events as structured JSON Event payloads, and Chargebee RevRec supports accounting close workflows with generated journal entries, so forecast assumptions can be checked against source records during review.
| Model | Best for | Required inputs | Pros | Cons | Failure mode | Verification checkpoint |
|---|---|---|---|---|---|---|
| MRR Buildup Model | Teams that need an explicit movement view when definitions are still unstable | Opening MRR, new, expansion, churn, contraction | Makes movement ownership visible; a published guide frames it for $5K-$50K MRR and reports 60-80% accuracy for 1-3 month forecasts | Can understate downside risk if used as the only view | Teams classify the same account movement differently across functions | Reclassify a sample of recent account changes and confirm agreement with billing exports and ledger journals |
| Churn stress model | Downside planning when retention risk is rising | Gross churn, net churn, expansion-offset policy, scenario assumptions | Gross churn isolates revenue loss; net churn shows impact after expansion offsets | Requires clear, stable offset policy | Offset policy changes create trend noise that looks like performance change | Compare a period where gross worsened but net stayed flat, and validate offset treatment |
| Decision rule | Picking a practical starting point | Metric-definition memo, webhook event map, journal tie-out | Keeps model choice tied to audit-ready evidence | Adds setup before first readout | Forecast is shared before source events and journals reconcile | If definitions are unstable, start with MRR Buildup Model; if downside risk is rising, pair it with a churn stress view |
Under time pressure, choose the model with the strongest evidence pack first. Forecasts anchored to stable definitions, webhook traceability, and journal reconciliation hold up better than a cleaner-looking net story.
For a step-by-step walkthrough, see Choosing Between Subscription and Transaction Fees for Your Revenue Model. If you're looking
Best model for a stable monthly operating baseline#
Use the MRR Buildup Model when you need a canonical monthly view that can move from Subscription Analytics into leadership reporting and still hold up in close review. It starts with opening MRR and explains movement through explicit buckets instead of a blended growth number.
Build the monthly bridge with these components: opening MRR, new MRR, expansion MRR, churn, and contraction MRR. Keep definitions tight, and set clear ownership or review for each bucket so movements are not double-counted or reclassified late.
Published comparisons place this model around 60 to 80% accuracy for 1 to 3 month forecasts. That makes it useful for a stable operating baseline, but it is not a full downside-risk model by itself.
- Pros: easy to explain, govern, and carry through month-end reporting
- Cons: can miss fast risk shifts if used alone
Before you publish month-end numbers, verify that each movement bucket reconciles from your operational reporting layer to posted ledger journals and general ledger balances, using the same chart-of-accounts mapping used in close. If a bucket does not reconcile, treat the forecast as provisional until the mapping is fixed.
Best model for expansion led growth decisions#
Use an expansion-led model when growth decisions depend on existing customers expanding spend, and keep one strict rule: Expansion MRR excludes all new-customer revenue. If you blur that boundary, pricing and product signals can look stronger than they are.
| Line | What it captures | Account context |
|---|---|---|
| Upgrade MRR | Higher recurring price from an existing customer plan change | Existing customer |
| Add-on MRR | Recurring revenue from added modules or features on an active subscription | Active subscription |
| Free-to-paid MRR | Recurring revenue when an existing account moves from free to paid | Existing account |
| Reactivation MRR | Recurring revenue when a previously inactive account returns | Previously inactive account |
Keep your monthly MRR bridge as the baseline, then use expansion as a separate decision lens for upgrades, add-ons, and conversion paths. In this model, expansion is recurring revenue added by existing customers, not new business.
For first-period edge cases, enforce clear classification. If a new customer starts with multiple plans or buys more than one item at signup, keep that movement in New Business MRR rather than splitting it into new plus expansion.
For cleaner reviews, keep those lines separate rather than collapsing them into one blended expansion bucket. That does not eliminate overlap risk, but it makes classification disputes easier to resolve.
Track this alongside churn views. Net MRR churn already offsets contraction and churn with expansion, so it can hide gross loss patterns that matter for downside planning. Pair the expansion view with gross churn to see total revenue loss without expansion offsets.
For a working model centered on MRR growth and churn scenarios, read Subscription Revenue Forecaster: Model MRR Growth and Churn Scenarios.
Best model for downside planning under churn pressure#
When downside risk matters, treat Gross MRR churn as the primary stress signal and Net MRR churn as a companion signal. Gross churn is loss-only, so it can never be negative, while net churn reflects contraction and churn offset by expansion. That means net can look stable while loss pressure is still building.
| Signal | Definition in this article | How to read it |
|---|---|---|
| Gross MRR churn | Loss-only recurring revenue lost from contraction and churn | Primary stress signal; it can never be negative |
| Net MRR churn | Contraction and churn offset by expansion | Companion signal; it can look stable while loss pressure is still building |
| Gross-net divergence | Gross churn rises while net churn stays flat | Warning to review retention pressure before assuming conditions are stable |
After expansion-led periods, this distinction matters more. Gross churn tracks recurring revenue lost from contraction and churn, while net churn subtracts expansion from that loss view. In practice, track both monthly on the same cadence, with the same starting MRR and event window, so finance and ops are reading the same trend.
Pair the two metrics on one monthly operating rhythm#
Use one monthly close process for both metrics. A monthly cadence is a practical operating baseline, and it helps prevent false trend signals from mixed cutoffs or date logic. Keep this interpretation in view as well: gross churn will be higher than net churn because net includes expansion offsets.
As directional context, SaaS businesses above $10,000 MRR are often cited around 4-5% gross churn per month, while businesses below $10,000 MRR may run closer to 8-9% per month. Use those as reference points, not targets.
Lock offset policy before trusting the chart#
The formula is not enough. Write and maintain a stable policy that defines:
- What counts as gross loss: which contraction and churn events are included, and which date field sets the month
- What can offset net churn: which expansion movements are allowed to reduce net churn
- What denominator is fixed: the same starting MRR basis for both gross and net
Then verify classifications with a monthly sample across finance and ops. If one side maps by invoice date and the other by subscription-change date, trend comparisons become unreliable.
Treat gross-net divergence as a downside warning#
If gross churn rises while net churn stays flat, treat that as a warning to review retention pressure before assuming conditions are stable. Expansion can mask underlying loss patterns, so inspect contraction and cancellation drivers directly before making new cost commitments from the flatter net view.
The recurring failure mode is policy drift: formulas stay intact, event mapping changes, and dashboards still look clean while signal quality drops. For benchmarks, see SaaS Subscription Billing Benchmarks: Churn MRR Expansion and Payment Decline Rates.
Best model when failed payments distort reality#
When failed payments create a gap between booked MRR and collectible revenue, model subscription movements first, then apply recovery effects as a separate layer.
This approach keeps the core signal clean before payment operations change outcomes. Stripe notes failed subscription payments can cost about 9% of annual revenue, so mixing recovery into growth or churn buckets can hide a material issue.
- Calculate core MRR movements
Build opening MRR, new, contraction, churn, and Expansion MRR from subscription events, not collection outcomes.
- Apply recovery adjustments
Layer in Dunning Management and Payment Recovery after the baseline is set. Dunning is the communication and collection process for due or past-due payments, and in one documented auto-collection flow it starts when a failed payment moves the subscription to past due. Paddle also documents retries of up to seven times over a 30-day window for some auto-collected subscriptions before cancellation.
- Reconcile to Ledger journals before close
Before close, confirm the lifecycle from invoicing through cash settlement and revenue recognition, rather than relying only on billing-dashboard labels.
Do not book recovery as growth#
The red flag is classifying recovered revenue as Expansion MRR. That can overstate growth and hide collection risk.
Taxonomies differ, but some MRR frameworks separate Reactivation MRR from expansion, upgrade, and new MRR. ChartMogul defines reactivation as revenue from previously active customers moving back onto a paid plan. If an account returns to paid status after failed-payment recovery, treat it as recovery or reactivation unless there is a true plan upgrade on top of that recovery.
Use a monthly checkpoint: sample accounts that moved to past due and later returned to paid status, then verify the failed-payment date, retry or dunning outcome, and journal trail through cash settlement. If billing labels the account as "expanded" but journals show collection of an already-booked invoice, that is recovery, not growth.
Best model for finance close and reporting integrity#
For close-ready reporting, use a bridge model: keep MRR and ARR as operational metrics, then reconcile them to the GAAP view with documented policy, evidence, and approvals.
- MRR and ARR to GAAP bridge
Build your operational movement schedule first (opening MRR, new, expansion, contraction, churn, ending MRR), then keep a separate reconciliation into reported revenue. Do not treat MRR as a GAAP accounting measure by itself. GAAP is the standardized framework issued by FASB, and for public-company SaaS reporting your bridge must reflect ASC 606 timing for annual periods beginning after December 15, 2017. If you cannot explain monthly differences across MRR, ARR, billed amounts, and recognized revenue, the close view is not ready.
- Evidence pack with policy memo and Ledger support
Keep a minimum evidence pack: a churn-definition policy memo, reconciliation exports from Ledger journals, and documented change approvals. The memo should define gross churn, net churn, Expansion MRR, reactivation, and recovery, plus exclusions, so teams are working from one dated policy. That gives you a journal-backed explanation when metrics move instead of forcing you to rely on dashboard labels. As a monthly checkpoint, sample accounts with mid-month plan changes and confirm metric classification against the journal trail used in close.
- Control ownership and change approval
Set explicit ownership: one finance owner for the bridge and one operational owner for source-metric definitions, with approval required before any close-period classification change. This aligns with ICFR expectations that management establish and maintain adequate internal control over financial reporting. The tradeoff is more process overhead, but it reduces silent taxonomy drift, unsupported reclasses, and late error-materiality reviews that can raise restatement risk.
Practical rule: if a number is going into a board deck, lender pack, or audit discussion, attach the bridge and evidence pack before close, not after.
If you need a tighter churn baseline for the model, read How to Calculate and Manage Churn for a Subscription Business.
Best model for integrated platform operations at scale#
At scale, the best final model layer ties forecast confidence to execution controls, not just metric math. After your revenue bridge is defensible, test whether money can actually move, clear, and close on time through controls like Webhook delivery health, virtual-account timing, payout states, and verification or tax gates.
Webhooks health as a forecast confidence control#
Webhook delivery health is a forecast control, not only an engineering concern. Webhooks deliver Events to your endpoint over HTTP requests, and failed deliveries can be retried several times, so a clean-looking model can still be operationally behind.
Before you publish forecast or close-facing numbers, confirm the expected Events were received and processed, not only generated. At month-end, review failed deliveries, retry volume, and backlog, then flag where reported numbers may still depend on catch-up processing. A common failure mode is treating a partially reprocessed queue as complete.
Virtual Accounts timing and payout batch completion#
Cash and settlement assumptions should follow payout states, not billing activity alone. Stripe payout lifecycles include intermediate statuses like pending and in_transit and terminal outcomes like paid, failed, or canceled, so an initiated payout batch is not the same as a completed one.
Apply the same discipline to virtual-account assumptions. Architectures can include traditional and virtual accounts, but timing still depends on rails and context. For example, inbound transfers can take 2-4 business days unless same-day ACH is in use, and payout schedules vary by industry and country. Keep those caveats explicit in your forecast notes.
At cut-off, review aged balances and payout batches by status. If material amounts remain in pending or in_transit, avoid treating them as realized payouts or settled cash.
Verification and tax reporting gates#
Verification and reporting gates should be explicit in forecast notes because they can delay realization. KYC, KYB, and AML requirements can affect payout enablement, including cases where payouts are disabled if required information is not received by the deadline.
| Item | Role in the workflow |
|---|---|
| Form W-9 | Supports correct TIN collection for information returns |
| Form W-8 BEN | Submitted when requested by the payer or withholding agent |
| Form 1099-K | May need to be filed by payment settlement entities, where applicable |
| VAT returns | May need to be submitted by taxable suppliers |
Tax workflows belong in this same control layer. Form W-9 supports correct TIN collection for information returns, and Form W-8 BEN is submitted when requested by the payer or withholding agent. Where applicable, payment settlement entities may need to file Form 1099-K, and taxable suppliers may need to submit VAT returns. These do not affect every platform the same way, but open items can shift close timing and lower confidence.
A practical monthly pack includes open verification requirements and deadlines, missing W-8 or W-9 documentation by payee group, and unresolved VAT or Form 1099 dependencies. This is the final decision layer because it connects model output to whether funds can settle, payouts can release, and close can hold under scrutiny. For a related comparison, see ARR vs MRR for Your Platform's Fundraising Story.
Conclusion#
If you need a forecast that can survive finance review, board questions, and month-end close, choose discipline over extra math. What matters is not how many formulas you built. It is whether your inputs, movement rules, and controls hold up when someone asks you to prove them.
- Start with a clear operating view
Use a primary model your team can explain from opening balance to closing balance without reinterpretation. For many teams, that can mean a Monthly Recurring Revenue (MRR) buildup with explicit movement buckets such as new, expansion, contraction, and churn. Its real advantage is traceability: accurate forecasts start with the right inputs, and recurring-revenue movement needs to be captured clearly.
The checkpoint that matters most is simple: before you publish, reconcile supporting subledger balances to the general ledger, surface exceptions for action, and keep the supporting movement file. Letting teams redefine core terms mid-quarter can make trends harder to trust.
- Pair it with a downside view
A base case alone is often not enough when plans depend on retention and collections holding up. Scenario analysis is standard practice because managers evaluate multiple future states, including downside, and common guidance explicitly includes a worst case scenario. The differentiator is not complexity. It is that your stress view shows what breaks first if gross churn worsens, payment recovery underperforms, or expansion slows.
If definitions are still moving, keep the stress model narrow. Use the same movement policy as the primary view and only change the assumptions that drive risk. As a practical governance approach, keep those definitions steady across reporting cycles before changing policy, or trend lines will reflect reporting changes more than business changes.
- Do not confuse operating metrics with recognized revenue
Your forecast is decision-ready when it is reconciled, caveated, and bounded correctly. MRR is an operating metric, not cash received and not GAAP revenue, so leadership should see both Monthly Recurring Revenue and Annual Recurring Revenue for horizon context while finance keeps the bridge to reporting rules. The differentiator is credibility: subledger-to-general-ledger reconciliation should surface exceptions for action, not sit as an afterthought.
The evidence pack should include the churn policy note, reconciliation exports, and any caveats tied to collections or compliance judgment. That last part matters more than many teams admit. Failed payment recovery can materially affect revenue recovery, and ASC 606 application still requires ongoing judgment and disclosure discipline. If those caveats are explicit and your balances reconcile, you have a forecast you can use for real decisions.
Frequently Asked Questions
What is MRR Expansion Rate and what should be excluded from it?
Treat it as the pace at which existing customers add recurring revenue through upgrades, reactivations, and free-to-paid moves. Keep new customer revenue out of it, and document edge cases up front. One concrete exclusion from Chargebee’s expansion metric is IN TRIAL to ACTIVE conversions, so if your team includes those, say so explicitly rather than letting the definition drift.
How should we calculate churn when teams disagree on offsets?
Show gross churn and net churn side by side until the policy dispute is settled. Gross looks only at MRR lost, while net offsets churn and downgrades with expansion and reactivation from the existing base. If people are still arguing after that, freeze one written rule for at least a full reporting cycle and do not let each team net its own offsets.
What is the operational difference between gross churn and net churn?
Gross churn tells you how much recurring revenue is leaving before any rescue from upgrades or reactivations. Net churn tells you whether the existing base is still growing after those offsets. If gross rises while net stays flat, expansion may be offsetting underlying retention issues, so investigate both metrics together.
Should platform teams forecast using MRR, ARR, or both?
Use Monthly Recurring Revenue (MRR) as the operating baseline for monthly forecasting. Use Annual Recurring Revenue (ARR) as the longer-horizon view for leadership or board reporting. In practice, you want both, but the monthly model should be the one you verify first.
How do Dunning Management and Payment Recovery change forecast accuracy?
Dunning is the process of retrying failed payments and sending reminders after declines, and Stripe Smart Retries is designed to automatically retry failed subscription and invoice payments to reduce involuntary churn. Forecast accuracy improves when recovery is modeled as a separate layer after core MRR movements are classified. Keep movement buckets distinct so recovery and expansion are not double counted.
How do we prevent double counting between Expansion MRR and churn adjustments?
Segment movements into new, expansion, contraction, and churn before you combine any views. Then assign each upgrade, downgrade, or reactivation to one primary bucket at the event level. The red flag is duplicate upgrade treatment, where the same customer change is counted once in Expansion MRR and again as an offset inside a net churn adjustment.
What minimum evidence should finance require before approving a forecast?
At minimum, require a movement file that separates new, expansion, contraction, and churn, plus a short policy note showing how gross and net churn are defined. Finance should also have subledger to general ledger tie outs that compare open receivables or payables balances in the subledger to the corresponding account balances in the GL. If those tie outs do not reconcile, the forecast should not be signed off, no matter how clean the dashboard looks.
Try a related tool
Researched and edited by the Gruv editorial team. Gruv builds cross-border billing, payouts, and finance-operations software for global businesses.
Sources
Includes 1 external source outside the trusted-domain allowlist.
Educational content only. Not legal, tax, or financial advice.
Related Posts

Subscription Revenue Forecaster for MRR and Churn Scenarios
A subscription revenue forecast is only useful when it survives real subscription operations, not a neat spreadsheet version of the business. For a capable finance or RevOps team, the job is to project recurring revenue clearly enough to support decisions, then test whether those projections still hold once billing, churn, and exceptions show up.

How to Compare SaaS Billing Benchmarks Before Expansion
For expansion decisions, treat payment decline rate, churn, and expansion as one system, not three separate metrics. That gives product, finance, and GTM a view they can defend before rollout resources are committed. If you own the budget call, you need that view before your team starts treating one good month as a trend.

A Guide to Dunning Management for Failed Payments
If you run recurring invoices, failed payments are not back-office noise. They create cashflow gaps, force extra follow-up work, and increase **Involuntary Churn** when good clients lose access after payment friction.