
Quick Answer
Calculate commission revenue from eligible GMV, then gross profit from recognized revenue minus cost of revenue. Divide gross profit by revenue for gross margin. Include collection, payout, FX and failure costs under your accounting policy, and show broader variable costs in a separate contribution view. Compare both margin percentage and profit dollars under volume, fee and cost stress cases.
How to model platform economics on gross margin, not just top-line fee percentage#
Compare take rate, gross profit and gross margin before changing fees. Then calculate a separate contribution view for operating costs your accounting policy excludes from cost of revenue. A stronger percentage can still produce fewer dollars if transaction volume falls.
Gross profit is recognized revenue minus cost of revenue; gross margin is gross profit divided by that revenue. GMV is transaction value, not automatically platform revenue. An agent typically recognizes its fee rather than the full seller sale; a principal’s revenue and costs can be presented differently. Lock the revenue basis and cost classification first so a GMV-based percentage is not mistaken for a revenue-based margin.
That distinction matters because growth can hide weak economics for a long time. You can be growing fast and still have weak economics if margins are off. A fee change can look strong in a dashboard built around top-line volume, then disappoint once cost-of-revenue items are included.
Before you start#
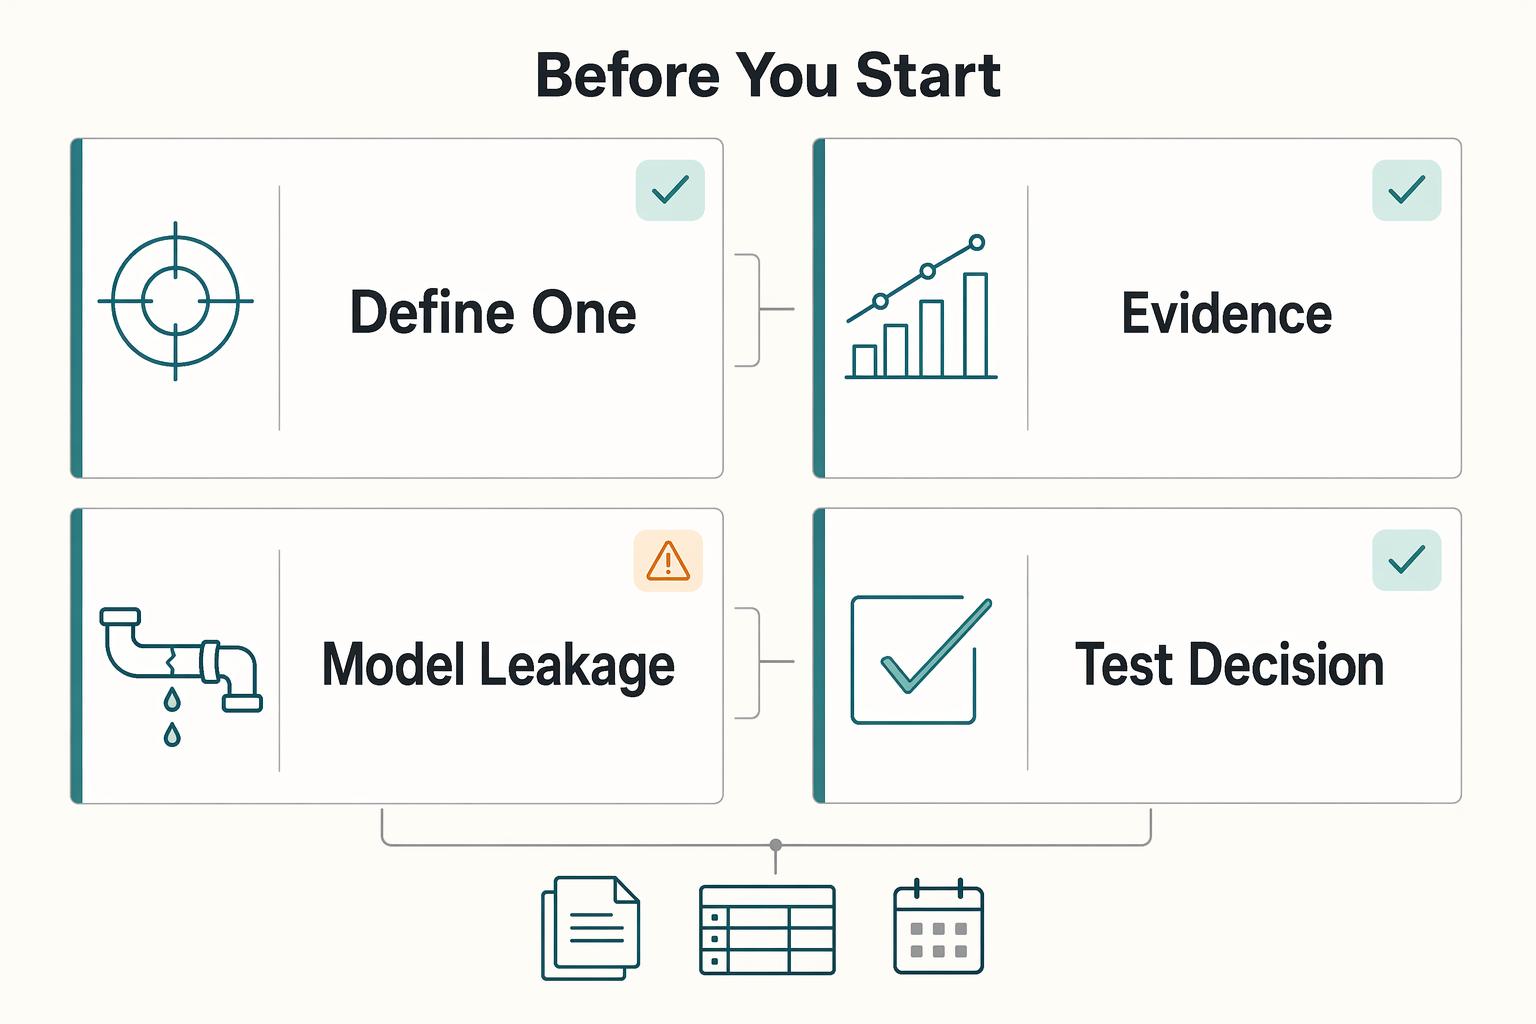
Use this guide as a shared working model for finance, ops, product, and engineering, not as a finance-only spreadsheet. The goal is decision-ready unit economics: can each transaction, seller segment, or payout flow create more value than it costs? If you cannot answer that at the unit level, you are not ready to change fees with confidence.
| Step | Action | Check |
|---|---|---|
| Define one margin view | Fix revenue recognition, cost-of-revenue policy, gross profit and margin; show any broader contribution view separately | Leadership sees one set of numbers, not a finance version and a product version |
| Tie assumptions to records | Build your first pass from actual records for at least one recent month | Label actual records, quotes and hypotheses separately; test uncertain inputs |
| Model the leakage paths early | Include cost-of-revenue items that sit between collection and disbursement, even if they look small at first | If a proposed fee increase only works under perfect operating assumptions, the model is too fragile for launch |
| Test the decision, not just the math | Run a baseline case, an upside case, and a failure case where costs rise or conversion drops | You know whether margin improves only on paper or under normal operating conditions too |
Use the same revenue basis and cost policy across scenarios. Show gross profit dollars and gross margin percentage together, plus a separate contribution measure where variable support or compliance costs sit outside reported cost of revenue. This gives the team a consistent view without hiding a loss-making cohort behind an attractive take rate.
For a step-by-step walkthrough, see Choosing Between Subscription and Transaction Fees for Your Revenue Model.
Separate platform commission economics from sales comp terms#
Keep your platform pricing metrics and sales compensation metrics separate from the start. A platform fee percentage on GMV is not the same thing as a sales gross margin commission plan.
- Define the two terms once, in writing.
Define GMV as eligible transaction value for your chosen period, with explicit treatment of refunds, cancellations, taxes and shipping. Commission take rate is commission revenue divided by that same GMV base. A sales gross-profit commission plan instead determines compensation from a specified profit base; its rules are separate from customer pricing.
- Set one canonical formula and one revenue base.
Write the formulas beside the model: commission revenue = eligible GMV × applicable rate; total recognized revenue adds other earned fees and subtracts relevant revenue adjustments. Gross profit = revenue − classified cost of revenue. Gross margin = gross profit ÷ revenue; show it as undefined when revenue is zero. A contribution view subtracts the additional variable costs you specify, without calling them reported COGS.
- Add a "do not confuse" line when both appear.
Use a plain note such as: "Platform take rate on GMV is not a sales gross margin commission plan metric."
- Use a traceability gate for fee decisions.
For historical metrics, trace the denominator and fee or cost calculation to source records. Keep forecasts and quoted route prices labelled separately so measured results are not mixed with planning hypotheses.
Gather the minimum inputs before you run any fee scenario#
Use traceable cohort inputs for measured performance. Keep forecast assumptions explicitly labelled and run sensitivities where prices, volume or failures remain uncertain. Blended averages can hide the expensive lanes.
Build the input pack first#
Before you model scenarios, assemble a minimum input pack:
- Gross Merchandise Value (GMV) mix by segment
- Current take rate by that same segment
- Payout rail costs
- Direct processing costs by corridor
- Collected fees, fee refunds and permitted fixed charges
- Billed failed attempts, variable support/review and the cost classification for each
Keep segmentation consistent across files. If GMV, payout cost, and processing cost use different segment logic, your model will mix unlike inputs and create false precision. For each segment, you should be able to name the source report and the owner who can reproduce it.
Treat compliance and tax gates as conversion assumptions#
Include the identity, sanctions and tax-document checks actually required by your provider, payment role and corridor. US payer documentation can involve W-9 or the applicable W-8 form; these are not universal global payout gates. Model review effort and timing separately from demand conversion. A delayed payout does not erase an earned beneficiary obligation or automatically change recognized revenue.
| Gate or form | Model as | Possible outcome |
|---|---|---|
| Identity and screening | Actual provider/program requirement and review cost | Onboard, review, reject or hold under that program |
| US tax documentation where applicable | Required form, validation effort and withholding/reporting treatment | Collect/correct evidence and apply the appropriate tax treatment |
| Pending payout | Outstanding obligation, release condition and funding timing | Keep principal accounted for until valid disposition |
Separate seller onboarding conversion, payable obligations and payment completion. Missing or pending documents may delay a payout without changing the amount owed. Track that amount as held or pending according to the actual program, with an owner and release condition; do not count held funds as platform revenue.
Prove the money-movement path with systems evidence#
Support each lane with systems evidence: webhook event logs, retry behavior under idempotency, and reconciliation exports from initiation through completion, return, or reversal.
If provider status and reconciliation records do not match, keep that lane unresolved until you can trace it end to end for a recent sample cohort.
Reject stale or unsupported assumptions#
Use at least one recent month to anchor material assumptions, and label seasonality or thin-cohort gaps. A new route may have no historical sample: use its quoted charges and explicit volume, failure and review ranges as hypotheses, then test them in a pilot. Keep that scenario separate from measured performance instead of excluding all forecasts.
For legal or policy assumptions pulled from public registries, verify against an official edition or counsel before you use them to change the model.
Related: Currency Risk for Platforms: How to Protect Gross Margin When Collecting in USD and Paying in INR.
Map margin from collection to disbursement with a full cost bridge#
Use one cost bridge from collection to disbursement, with fixed row order and fixed segment logic across scenarios. If a fee change only improves margin before payout, FX, settlement, or compliance handling is included, treat it as unproven.
Build one bridge from collection to disbursement#
Build one table and keep assumptions explicit in every column.
| Bridge line | Baseline | Fee increase | Mixed pricing with partial unit fee scheme |
|---|---|---|---|
| GMV | Current eligible GMV by segment; payout completion and held obligations tracked separately | Same mix unless you explicitly model a change | Same mix, with unit fee applied only to selected segments |
| Commission revenue | Current take rate by segment | Higher take rate only where the change applies | Base take rate on GMV; record unit fee once in other fee revenue |
| Non-commission revenue | Current non-commission charges, if any | Unchanged unless packaging changes | Changes only where packaging or unit fee changes revenue |
| Collection processing costs | Current collection charges and cost classification | Change with volume and selected collection methods | Include collection costs even if only payout pricing changes |
| Direct payout costs | Current payout-path costs by segment | Hold constant unless behavior or mix changes | Test recovery on higher-cost lanes |
| FX and settlement friction | Current conversion and timing treatment | Same unless corridor mix or timing assumptions change | Isolate impact on targeted corridors |
| Compliance handling costs | Current review, document, and exception-handling treatment | Include any added handling load from the pricing change | Recover cost only from cohorts that create it |
| Gross profit / gross margin | Revenue minus classified cost of revenue / divided by revenue | Same basis and policy | Same basis and policy |
| Additional variable operating costs | Review/support outside cost of revenue under policy | Reflect new load and seller response | No double-counting costs already in COGS |
| Operating contribution | Gross profit less specified additional variable costs | Show dollars and per-transaction amount | Label definition and reconcile to reported margin |
For each row, name its source, period and whether it is measured, quoted or hypothetical. Do not quietly replace a missing input with zero. Use a sensitivity range for uncertain costs and state which result depends on it.
Worked example: a higher margin percentage can hide lower profit#
Assume an illustrative agent platform with USD100 average transactions, commission-only revenue and no taxes or refunds in this example. Classified cost of revenue totals 4 percent of GMV: collection 3 percent, payout 0.5 percent, FX 0.4 percent and billed failure costs 0.1 percent. An additional support cost of USD0.50 per transaction sits outside COGS under the assumed policy. These are planning inputs, not provider prices.
| Measure | Baseline | 12% fee,10% volume loss | 12% fee,40% volume loss | 10% plus USD1 fee,10% volume loss |
|---|---|---|---|---|
| Transactions | 1,000 | 900 | 600 | 900 |
| GMV | USD100,000 | USD90,000 | USD60,000 | USD90,000 |
| Recognized fee revenue | USD10,000 | USD10,800 | USD7,200 | USD9,900 |
| Classified cost of revenue | USD4,000 | USD3,600 | USD2,400 | USD3,600 |
| Gross profit | USD6,000 | USD7,200 | USD4,800 | USD6,300 |
| Gross margin | 60% | 66.7% | 66.7% | 63.6% |
| Additional variable support | USD500 | USD450 | USD300 | USD450 |
| Operating contribution | USD5,500 | USD6,750 | USD4,500 | USD5,850 |
At 12 percent take rate and 4 percent cost of revenue, gross profit is 8 percent of GMV. It takes USD75,000 GMV to match the baseline USD6,000 gross profit; a larger volume loss makes that dollar result worse even though gross margin stays 66.7 percent. Fixed costs, taxes, refunds and changing mix would alter the result. Test those separately before choosing the headline rate.
Break out module-level economics only where they change the path#
Break out Virtual Accounts, Merchant of Record services and payout batches when their actual contracts change delivery, revenue recognition, charges or exception handling. A product label alone does not determine whether revenue is gross or net. IFRS 15 principal/agent guidance assesses control of the specified service, with the contract facts and relevant indicators.
Make FX and settlement friction explicit#
Keep quote, conversion execution and payout amounts separate. Record provider FX charges and any residual currency exposure, without counting the same spread twice. Pending payouts are a cash-timing and liability issue; revenue recognition follows the applicable service and contract policy. Show funding or holding costs separately when they belong outside reported gross margin.
Use this as a launch gate: if the fee increase only works under idealized assumptions, test the mixed model before shipping a blanket change.
Choose a commission structure that matches segment behavior#
Choose the structure that matches your segment economics, not the one that is easiest to present. Keep commission changes separate from sales-team compensation design: sales compensation is built to motivate sales agents, while platform fee design should follow your transaction economics and margin path.
Compare structures side by side#
| Structure | Best fit | Main risk | Rule for use |
|---|---|---|---|
| Flat take rate | Segments are similar enough in cost and pricing behavior | Expensive cohorts get cross-subsidized | Use when segment spread is limited and exceptions are rare |
| Category grid | Segments differ enough to justify distinct pricing | Too many categories and override requests | Keep categories limited and tied to observable cohort differences |
| Hybrid fee model | One base rate works for most volume, with a defined high-cost subset | Exception logic becomes opaque | Define exception eligibility up front and keep it cohort-based |
Test pass-through assumptions before changing headline fees#
Model zero, partial and full seller pass-through into buyer prices, plus the resulting seller retention and buyer demand. Those are separate assumptions, not automatic offsets. If retention risk is high, test payout and failure-cost improvements first. For a fee experiment, set guardrails and a rollback that restores future fee terms while preserving already accrued obligations.
Keep fee logic distinct by GMV cohort when flows differ#
Set separate GMV cohorts where flow mechanics differ, including contractor payouts and marketplace catalog sales. Apply different fee logic only where a repeatable cost pattern is visible in the cohort, and document exceptions explicitly so finance and ops can reconcile them consistently.
Model payout operations before you change take rate#
If retry or return rates are rising, pause commission changes and stabilize payout quality first. Otherwise, you can mistake operational variance for pricing impact and misread gross margin.
Trace the payout lifecycle and assign margin effects#
Map initiation, required review, provider acceptance, completion and return or reversal. Record charges and labor associated with each transition, but count the underlying obligation once. A returned beneficiary transfer generally reopens the payment task; it is not automatically a refund of platform fee revenue. Apply the actual contract and accounting treatment to any fee reversal.
Use webhook and idempotency records to estimate failure cost#
Link duplicate webhook deliveries and repeated API requests to a durable payout instruction and each actual provider attempt. A suppressed duplicate request is not another disbursement, but may still incur processing or investigation effort. A failed attempt can carry a provider charge: use the provider invoice and outcome records, not only the count of completed payouts. Recover unknown outcomes before rerouting or retrying money movement.
Add compliance holds and exception paths#
Separate straight-through, review-held and returned payouts. Measure delay, funding exposure, review labor and applicable provider charges without counting the pending beneficiary principal as a platform cost or benefit. If failure pressure is rising, isolate that effect in the fee experiment and repair the payout path before expanding the pricing change.
Stress-test fee constraints and customer response#
Treat a possible fee constraint as a named scenario with a stated contract or jurisdictional trigger. It is not a base-case rule for every marketplace. Compare downside and adaptation cases while preserving the same cost classifications.
Build the policy cases first#
Model at least three cases before changing take rate:
| Case | What changes | Key assumption |
|---|---|---|
| Commission fee cap downside case | Percentage revenue is capped | Clearly labelled hypothetical cap or verified product-specific restriction |
| Unit fee scheme adaptation case | A unit fee may be used | Whether contract and applicable rule permit the additional fee |
| Constrained pass-through case | Price changes are limited or delayed | Realistic pass-through share |
For each case, state the fee base, assumed permitted charges, volume response and who bears additional costs. Define pass-through: how much of the platform’s extra charge sellers recover in buyer prices. Pass-through does not remove the platform’s own cost or guarantee stable demand.
Tie each constraint to your own product#
For an actual fee cap or pricing restriction, record the jurisdiction, affected product, fee base, effective date and whether additional fixed fees are permitted. Do not assume a unit fee can bypass a cap. For a hypothetical restriction, label it hypothetical and test it without presenting an app-store rule as a law for your platform.
Maintain an assumptions log that links each restriction to a real control point: the billing path, permitted charges, seller terms and any distribution constraint. If a proposed analogy does not affect your product, exclude it from the decision.
Refresh the scenario when the underlying rule, contract or product changes. Preserve the previous assumptions and explain which input moved, so a new result can be compared with the prior decision.
Add quality and innovation effects, then label uncertainty#
Model the service effects of pricing changes as explicit hypotheses. Lower fees may improve seller participation while reducing funds available for quality, trust or support; a higher fee may fund improvements but reduce activity. Test both sides rather than assuming either direction.
Model these as ranges, not precise point estimates. If lower fees may increase participation but reduce resources for quality, trust, or support, represent both effects separately and keep unknowns explicit.
Common margin model failures and how to recover fast#
Basic model hygiene usually breaks pricing decisions before policy shocks do. If you cannot show which GMV cohorts are cheap or expensive to serve, do not ship a fee recommendation.
Segment profit by how money actually moves#
The fastest failure is treating all GMV as equally profitable. A domestic payout on a clean path is not operationally equivalent to a cross-border payout that creates more review, exceptions, or support load.
Segment at minimum by payout rail, geography, and compliance path, then tie each segment back to ledger events and payout records from a recent period. This makes it clear whether margin compression comes from the corridor itself or from operational friction. Red flag: one blended take rate masking a loss-making corridor.
Add tax-document handling as an operating cost, not a footnote#
Model tax-document intake, validation, withholding calculations and reporting only where your payment role requires them. Use measured ticket volume, staff time, software charges and specialist review costs. Personal foreign-asset reports such as Form 8938 or FBAR are not standard transaction-pricing inputs for every platform.
Separate withheld amounts and taxes collected for others from the platform’s own fee revenue and operating expense. A USD100 beneficiary entitlement with USD10 applicable withholding still requires a USD100 allocation: USD90 to the beneficiary and USD10 to the tax authority. The withholding itself is not USD10 extra platform profit; administration can create a separate cost.
Lock accounting treatment before you compare scenarios#
Fix the gross-versus-net revenue assessment and cost-of-revenue policy before comparing scenarios. Under US GAAP, ASC 340-40 contract acquisition costs concern incremental costs of obtaining a customer contract, such as qualifying sales commissions—not commission revenue charged to sellers. Recoverable qualifying costs may be capitalized, with the relevant amortization and available practical expedient; do not classify every platform fee or payout as an acquisition cost.
Backtest prior periods and explain forecast errors by mix, processing and payout costs, tax-document volume or accounting changes. Airbnb’s 2025 filing illustrates why classification matters: it reports fee revenue as an agent, payment processing and chargebacks in cost of revenue, and operations/support separately. Use your own policy; its margin is not a template for every platform.
Put the model into a pricing review#
If you keep only one rule from this guide, keep this one: a higher commission alone is not enough evidence of durable margin. Durable margin usually depends on one shared definition set, segmented evidence, and a fee decision you can verify after launch. Use this as a copy-and-paste checklist for your next pricing review or a two- to four-week diligence sprint.
- Lock the glossary before touching the model.
Write a one-page glossary across finance, ops, product and engineering. Fix the GMV, commission revenue, gross profit, margin and contribution formulas and the analysis unit. Trace measured historical inputs to source records; label quotes, forecast ranges and new-route hypotheses separately and validate material assumptions through a pilot.
- Validate the input pack by segment, not by average.
Review pricing, conversion and direct costs by meaningful customer, product and corridor cohorts. For measured historical inputs, pick a recent month and confirm the underlying source records. For a new route or forecast, record the quote or hypothesis, uncertainty range and pilot check; do not present an assumption as observed performance.
- Run three scenarios and test funnel constraints explicitly.
At minimum, model a baseline case, an upside case, and a constrained or mixed-pricing case. State your pass-through assumptions clearly, then test where growth or margin pressure actually sits: capacity, conversion, velocity, or mix. This keeps scenario work tied to operating reality instead of headline fee changes alone.
- Treat regulation as material and jurisdiction-specific.
Before approving any price move, label policy-sensitive assumptions by country or market instead of treating one framework as universal. Digital platform regulation is an active issue across jurisdictions, so scenario conclusions should reflect where rules differ and where uncertainty is still high.
- Approve one decision with an owner, timeline, and verification plan.
Name the exact fee change, the decision owner, launch date, and first post-launch review date. Your verification set should track realized commission revenue, direct costs, conversion behavior, and unit economics against the pre-launch baseline, reviewed by segment rather than only in aggregate.
That is the standard worth holding: shared terms, segmented evidence, and one decision you can defend after the month closes.
Frequently Asked Questions
What commission range is common for platforms, and when does it stop being a useful benchmark?
There is no single useful percentage for all platform categories. Compare peers with the same service, buyer/seller fee base and gross-versus-net revenue treatment. Then test your own cohort costs and seller response. A quoted 10–20 percent range without those conditions is too weak to set pricing.
Does increasing `take rate` usually improve gross margin, or can it reduce margin after payout and churn effects?
A higher take rate can improve gross margin percentage while reducing gross profit dollars if activity falls. Calculate revenue minus cost of revenue, then divide by revenue for the percentage; keep variable operating contribution separate. The worked comparison above shows the same 12 percent rate producing different profit dollars as volume changes.
Which costs are most often missed when modeling platform gross margin?
Check collection processing, beneficiary payout charges, FX, hosting or service-delivery costs, refunds and failure charges under the actual cost-of-revenue policy. Measure variable review and support too, but put them in a separate contribution bridge when they sit outside reported COGS. Avoid counting beneficiary principal or withholding as platform expense a second time.
How should we model a potential `commission fee cap` without overreacting to `Apple App Store` dynamics?
Do not assume one platform's fee debates map directly to your business. Use scenario modeling instead: current fee, a capped-fee case, and an alternative fee structure, then compare how each case changes gross margin.
What is the practical difference between platform commission economics and a `gross margin commission plan`?
Platform commission economics measures fee revenue earned from transaction activity and the costs of delivering that service. A sales gross-profit commission plan determines what a salesperson is paid from a specified profit base. Document both formulas; contract-acquisition cost accounting does not determine your customer take rate.
How often should finance, ops, and engineering recalibrate margin assumptions and pass-through rates?
Do not assume a single required cadence applies, but a regular review cycle is important. Re-check assumptions whenever fee logic or delivery costs change, and monitor gross-margin trends because they can flag operational issues.
Try a related tool
Researched and edited by the Gruv editorial team. Gruv builds cross-border billing, payouts, and finance-operations software for global businesses.
Sources
Includes 2 external sources outside the trusted-domain allowlist.
Educational content only. Not legal, tax, or financial advice.
Related Posts
Choosing a Gross-to-Net Payout Model for Platform Disbursements
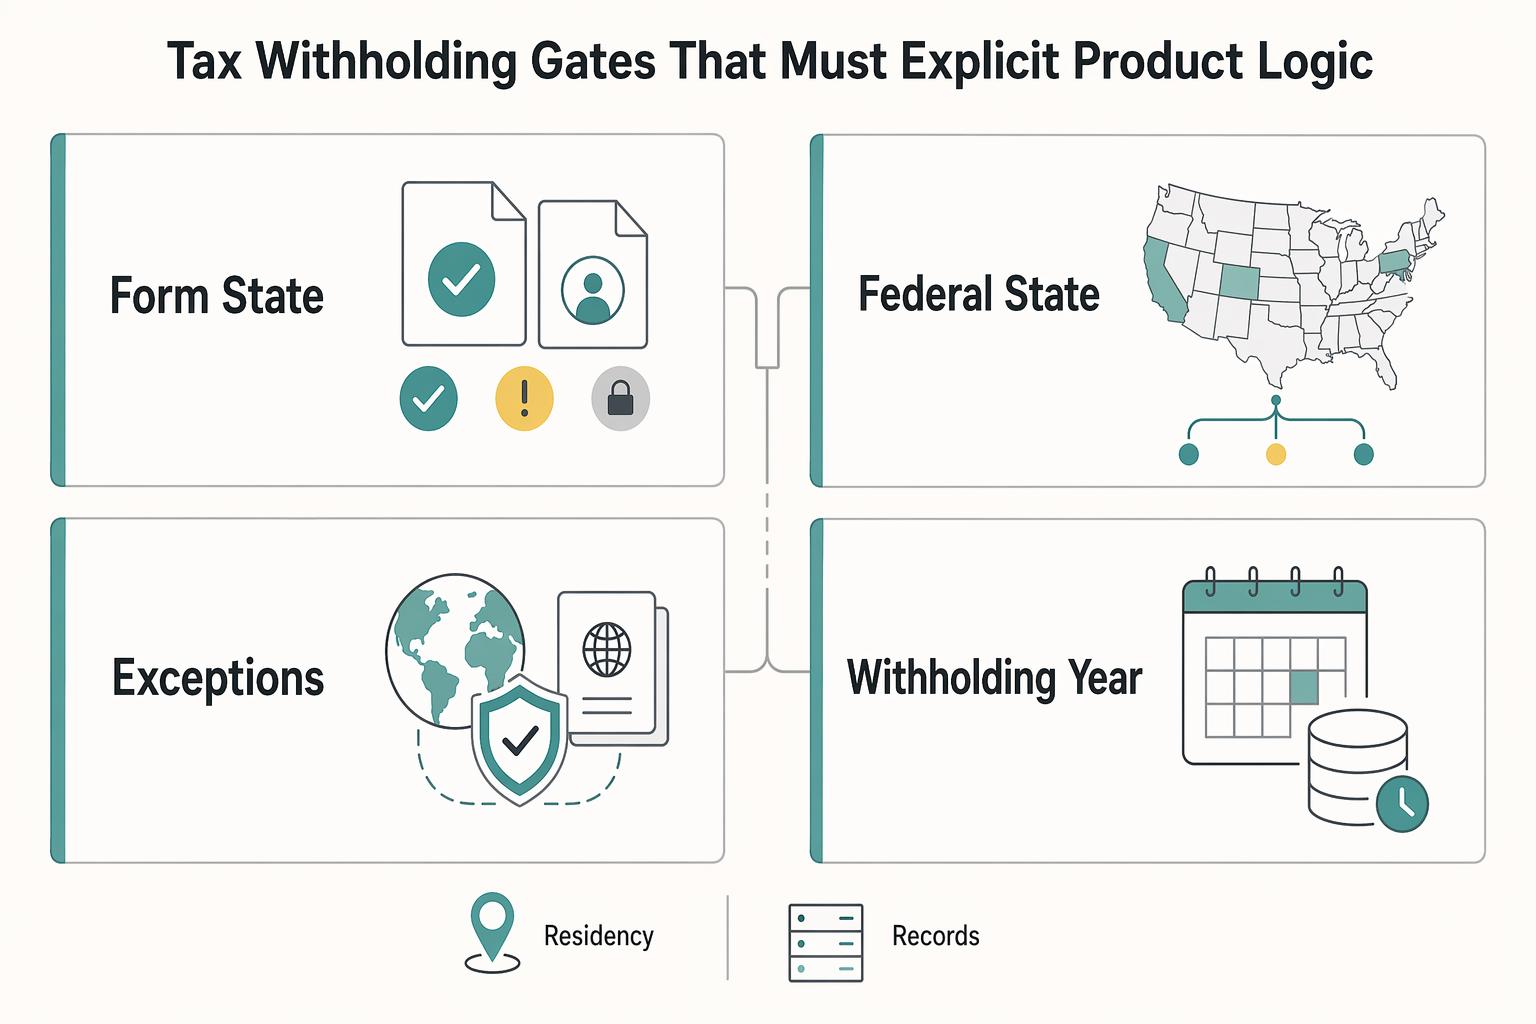
Payroll tax references matter, but they are not a payout architecture. Teams often collect withholding rules, filing-status details, and tax-form requirements before they have defined who owns each deduction line. That guidance still matters for withholding logic. [IRS guidance on the Additional Medicare Tax](https://www.irs.gov/businesses/small-businesses-self-employed/questions-and-answers-for-the-additional-medicare-tax) can be useful context for tax review, but it does not define deduction sequencing, ledger mapping, release gates, or recipient-facing payout explanations.
Currency Risk for Platforms Collecting USD and Paying INR
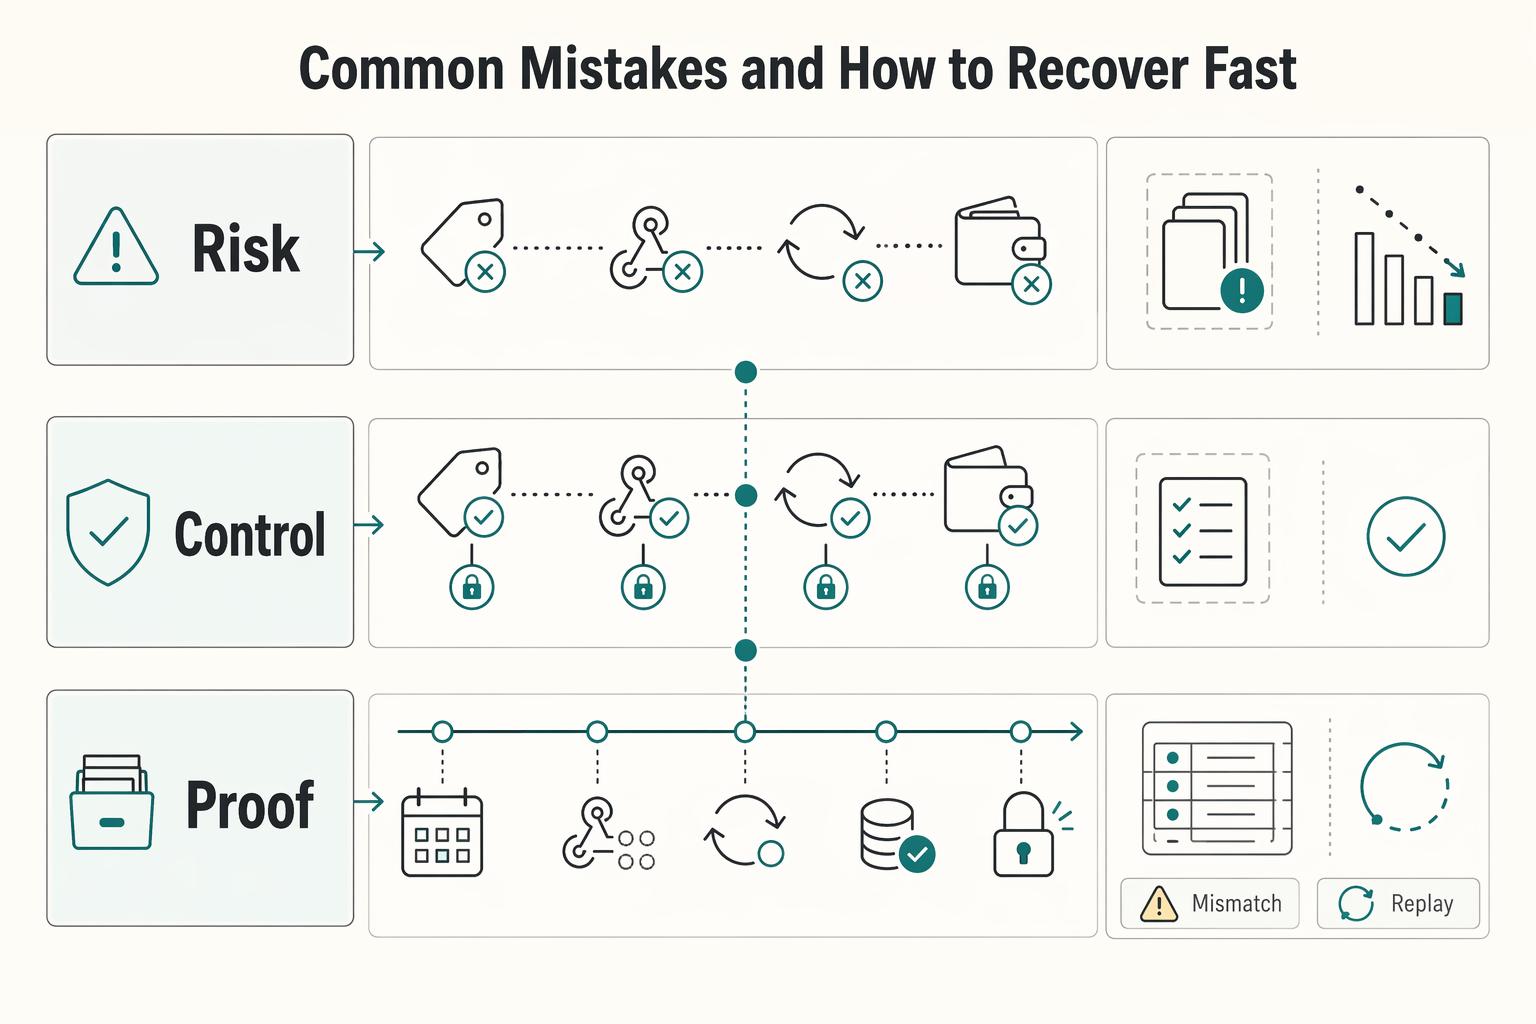
USD collection with INR payout creates a real gross-margin risk as soon as money movement happens across time instead of in one instant. The issue is simple: if the USD amount is known now but the INR conversion or payout happens later, your margin is exposed to the USD-INR move during that gap.
ASC 340-40 for Platforms: How to Account for Contract Acquisition Costs and Commissions
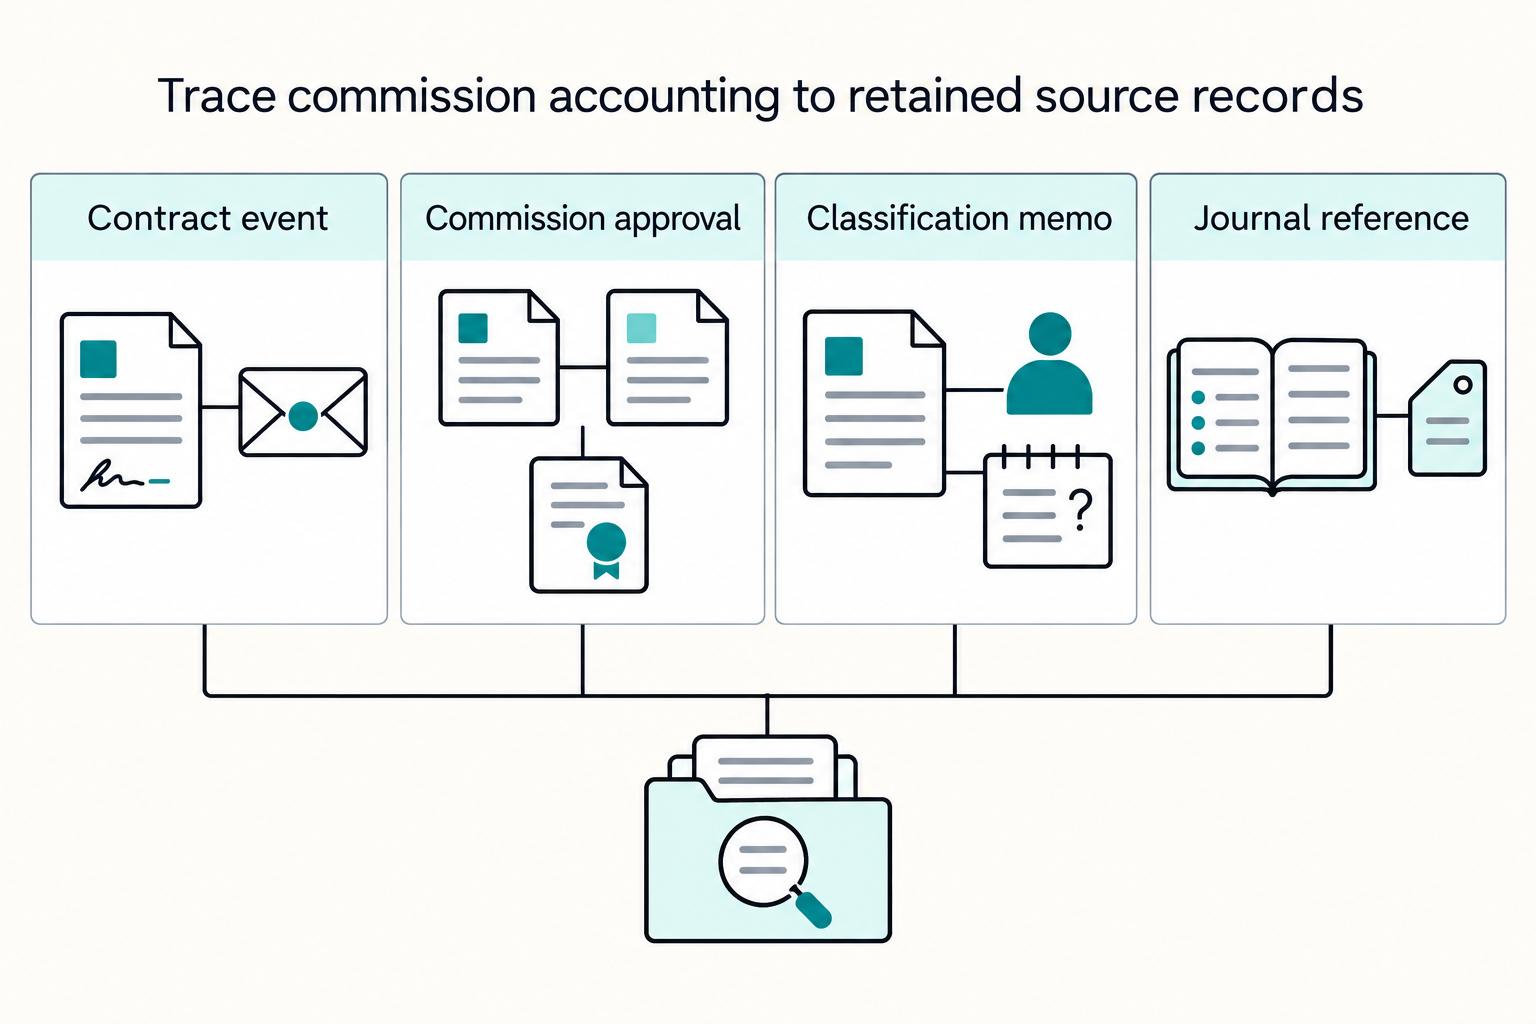
If you handle commissions or similar deal costs, start with two GAAP tests: is the cost incremental to obtaining a customer contract, and do you expect to recover it? If either answer is no, expense treatment is usually the right starting point.