
Quick Answer
Use a ranked stack, not one score: start with NPS, CSAT, and retention, then verify each shift in a payout reconciliation report and a settlement details report. Read NPS on its 0-10 input and -100 to +100 output by segment, not as a blended average. If CSAT is strong while reconciliation exceptions age, escalate controls; if retention drops with flat sentiment, investigate cohort mix, pricing fit, and payout friction before deciding root cause.
Customer success metrics that actually catch payment ops failure early#
Use NPS, CSAT, and retention as customer signals, then verify each against transaction records, matching controls, funds-movement evidence, and payout data before you act. In payment operations, these metrics help when they surface money-movement risk early, not when they are treated as proof that operations are healthy on their own.
The practical mix combines leading and lagging signals. NPS reflects relationship sentiment, CSAT captures a recent interaction, and retention shows whether customers stayed. None of them, by itself, tells you whether payouts matched bank batches or funds settled cleanly.
What makes a metric worth keeping#
A metric belongs on this list only if it passes four checks and points to a clear next action:
- It points to an owner. Finance can verify against payout matching and settlement records, ops can trace payout behavior or timing, and product can address the customer touchpoint.
- It moves fast enough to warn you. CSAT is useful as a "right here, right now" read of a specific experience.
- It can be checked against hard records. If sentiment shifts but payout matching and provider records are clean, the issue may be expectation or communication rather than execution.
- It segments cleanly. NPS can be tracked by segment, geographic unit, or functional group, which helps uncover concentrated issues hidden by blended scores.
How the core signals map to operations#
| Signal | What it tells you | Best used with | Where it can mislead |
|---|---|---|---|
| NPS | Relationship loyalty. Calculated as promoters minus detractors on a 0 to 10 scale, with 9 or 10 promoters, 7 or 8 passives, and 0 to 6 detractors. | Segment-level checks by customer segment, geographic unit, or functional group, followed by matching or payout review if detractors rise. | Good directional signal, weak root-cause signal. A drop shows trust changed, not exactly where execution broke. |
| CSAT | Satisfaction with a specific interaction, commonly measured on a 1 to 5 scale. | Moment-level checks after payout status updates, support resolution, or funds-availability notifications. | Easy to mistime. A strong event score can coexist with unresolved back-office exceptions. |
| Customer retention | Share of customers who stay over time; inverse of churn. | Cohort reviews by onboarding month, transaction volume, or payout pattern. | Confirms impact late. By the time it moves, damage may already be material. |
| Operational truth | Whether money movement matched and settled correctly. | A payout reconciliation report to match bank payouts to batches, plus a settlement details report for transaction-level review. | Can miss customer pain if you stop at finance correctness alone. |
Decision checkpoints when signals conflict#
When metrics disagree, check the money trail first with payout matching and settlement records. Stripe's payout reconciliation report is designed to match bank payouts to payment and transaction batches, and Adyen's settlement details report supports transaction-level reconciliation. Then use these rules:
- If NPS falls, segment before you generalize. Check whether the change is concentrated in a customer segment, geographic unit, or functional group.
- If CSAT looks healthy but match quality slips, treat it as silent-failure risk. Customers may not have felt the issue yet, but control quality is degrading.
- If retention declines while sentiment is flat, expand the investigation. Keep operations in scope, but do not assume a single cause from sentiment alone.
That logic carries through the rest of the list. Keep customer metrics, but make each one earn trust against operational evidence. For adjacent payment-authentication issues, see Strong Customer Authentication (SCA) for Subscription Platforms: Reducing Decline Rates.
How this list was selected and who should use it#
This list keeps only metrics that help you detect payment risk early and trigger a concrete operational check. If a score cannot guide finance, ops, or product to verification in financial records, reconciliation controls, or settlement timing, it may still be informative, but it is not operational.
Three filters shaped the list and kept it practical:
- Practical in finance and ops
We prioritized measures that show where payments break down, not just top-line sentiment. Each signal should lead to a next check, such as reconciliation match accuracy, processing and settlement timing, or transaction-record review. If no team clearly owns the follow-up, the metric is lower priority.
- Sensitive to failure and fast enough to matter
Customer signals like Net Promoter Score (0 to 10) and CSAT (1 to 5) are useful, but they should be paired with early-warning operational indicators instead of being used only for retrospective reporting. Lagging signals still matter, but they are not enough on their own in complex payment operations.
- Verifiable with operational reliability metrics
Sentiment stays in scope only when it can be tested against hard evidence. Reconciliation controls are the direct check for transaction-record accuracy, and processing and settlement time is an established payment KPI checkpoint. If a dashboard change does not imply a concrete action, it adds noise instead of clarity.
This section is for finance, payments ops, and product owners who need a shared operating view. It is a weak fit when the goal is only a brand-level CX scorecard without operational ownership, incident follow-through, or verification against payment records.
The best metrics to track first in payment operations#
Start with these seven metrics in this order. Read them as one stack: sentiment and retention show impact, while matching accuracy, timing, payout reliability, and exception handling help show whether money movement is correct.
| Metric | Best for | Leading or lagging signal | Key pros | Key cons | Concrete use-case in Payment Platforms |
|---|---|---|---|---|---|
| 1. Net Promoter Score (NPS) | Directional trust and loyalty across accounts or segments | Mostly leading | Easy to trend and explain; bounded from -100 to 100. Formula is promoters minus detractors. | Weak on diagnosis. Misleads when you rely on one blended score and skip record and matching checks after a drop. | Track NPS by payout corridor, customer tier, or product path. If detractors rise in one segment, review unmatched transactions, timing breaches, and support tickets before blaming UX. |
| 2. Customer Satisfaction Score (CSAT) | Event-level friction at a specific payment, funds-availability, or payout touchpoint | Leading | Fast signal tied to a single moment; captures a "here and now" reaction to a specific interaction or event. | Results can vary with survey timing and trigger design. Misleads when you survey immediately after a status message before the customer feels the impact of a delayed or failed payout. | Send CSAT after payout success and payout failure notifications, then compare results against retry outcomes and unresolved payout cases. |
| 3. Customer Retention | Whether operations keep customers over time | Lagging | Durable business outcome; calculable from period start, period end, and new customers in period. | Slow to react. Misleads when treated as early warning or read without segment-mix context. | Monitor retention by onboarding month and payout-volume tier. If retention drops while NPS is flat, check pricing, product fit, and account mix before assuming service quality is the issue. |
| 4. Reconciliation accuracy | Proving transaction-record integrity | Usually leading operational control (can be both) | Auditable; transaction-level matching directly tests whether settled activity and payout details match recorded activity. | Aggregates can hide localized breaks. Misleads when you report only top-line match rate and ignore aging unmatched items. | Match processor reports, internal journal entries, and payout records at transaction level. Escalate unreconciled items that age beyond close tolerance. |
| 5. Settlement timeliness | Speed and predictability of funds reaching expected balance or merchant accounts | Leading for operational stress | Strong checkpoint when "where is my money?" demand rises. | No universal benchmark. Misleads when comparing providers without risk, reserve, or payment-method setup context. | Track actual timing against each provider's configured model. For example, Adyen notes a 1 day settlement delay requires prior approval, so "late" should be judged against configured settings, not a generic T+1 assumption. |
| 6. Payout success rate | Reliability of payout execution | Leading | Directly tied to customer pain and support load; requires denominator discipline. | No single public industry formula from these sources. Misleads when retries or bank rejections are hidden inside a blended success figure. | Measure successful payouts against total payout attempts using one fixed internal definition, then split failures by provider, corridor, and failure reason (including bank-account mismatch). |
| 7. Exception-resolution time | Speed of resolving disputes, notifications, questions, and information requests | Leading for recovery, lagging for root cause | Shows whether the team contains damage once failures occur. | Public benchmarks are limited. Misleads when the timing start point is inconsistent (for example, ticket creation vs. first failed event). | Track median resolution time and backlog aging together. Since failed transfers can be cancelled in seconds, alert early instead of waiting for end-of-day review. |
How to use this ranking without over-trusting sentiment#
Use the first three metrics to detect impact, not to prove root cause. If NPS or CSAT moves, verify against transaction-level matching, timing by provider, and payout failure reasons with explicit codes and descriptions.
Keep transaction-to-payout traceability in your evidence pack. Stripe notes that automatic payouts maintain the association between each transaction and its payout. Without that traceability to payout IDs, journal postings, or unmatched items, sentiment shifts remain symptoms rather than evidence.
Benchmark caution matters more here than in generic CX work#
Benchmark data here is broad-industry, not payment-platform-specific. Qualtrics references over 300 companies across 20 industries, and NPS Prism reports over 1,000 companies and over 10 industries. Use those as directional context, not as operating targets for your own payout, reserve, and matching model.
The same caution applies to vendor-published points. ConnexPay published NPS 60 on October 2, 2025, based on 267 customers across multiple industries. That may be a valid company datapoint, but it is not a neutral market benchmark for your platform.
Best relationship signal when trust risk is rising#
NPS can work as a relationship-level early warning signal here, but it is directional, not diagnostic. One recommendation question on a 0-10 scale produces a score from -100 to +100, which makes it easy to trend and discuss quickly.
Use it to spot churn risk before it shows up in retention. Then verify with operational evidence before naming causes.
- Track NPS by segment, not only as one blended average
Cut by customer segment, geography, or functional group so a drop points to a specific area to investigate.
- Track Promoters, Passives, and Detractors as separate movements
Promoters are 9 or 10, Passives are 7 or 8, and Detractors are 0 to 6. A flat overall score can still hide trust risk if Promoters slide into Passives.
- Require a verification step before root-cause decisions
If detractors rise in a segment, check independent operational and customer evidence in that same segment before changing messaging or UX.
One red flag is a stable overall NPS with worsening segment mix, because a flat blended score can hide movement underneath.
Best moment-of-truth signal at checkout and payout touchpoints#
For step-level friction at checkout and payout touchpoints, CSAT is useful when you trigger it right after confirmed events. Use relationship-level metrics for drift, and retention for slower outcome tracking.
Timing determines whether the read is useful. If the survey fires before the backend confirms what happened, you may be measuring reaction to messaging rather than the actual outcome.
- Survey on confirmed events, not page views
Ask for feedback only after your backend confirms what happened. For checkout, tie CSAT to events like Stripe checkout.session.completed (success) or charge.failed (failed attempt) so each score maps to a specific attempt and journey step.
- Keep success and failure CSAT separate
Post-success and post-failure scores answer different questions, so do not blend them. On payouts, track CSAT by status changes such as Payout initiated, Payout authorised, Payout booked, Payout pending, Payout failed, Payout tracking, Payout credited, and Payout returned to avoid masking issues in failed or returned flows.
- Read CSAT alongside failure and retry patterns
After payout notifications across success and failure states, compare CSAT with payout execution failures and retries. For recurring payment failures, Stripe invoice.payment_failed includes retry-attempt updates. Smart Retries has a recommended default of 8 tries within 2 weeks, which helps you interpret low scores by attempt context.
The red flag is timing bias. Trigger too early or too often and results get noisy, but trigger only on success and unresolved exceptions stay hidden. For low scores, verify the linked event, retry count, final resolution, and whether the customer was still in a pending state when surveyed. For a step-by-step walkthrough, see Tipping and Gratuity Features on Gig Platforms: Payment and Tax Implications.
Best durability signal for whether the operation actually keeps customers#
Customer retention is the durability check. It shows whether customers stay over a defined period, not just report better survey scores.
Why retention matters more than sentiment here#
NPS and CSAT are useful CX signals, but retention is the outcome metric. It measures the percentage of existing customers who remain customers after a given period. That makes it a clear check on whether improvements translated into repeat customer behavior.
That matters operationally. NPS can look stable overall while a specific cohort weakens, and CSAT can look healthy after a resolved event without showing whether the customer returns later. Retention helps separate real improvement from cosmetic improvement.
How to measure it without fooling yourself#
Use cohorts instead of one blended retention number. Start with onboarding-month cohorts, then add internal segments relevant to your business model.
Keep the calculation strict: exclude new customers added during the measurement period. The standard structure is (customers you end with - new customers) / customers you started with. If new logos are included in the numerator, retention will be overstated and existing-account churn can be hidden.
What to backtrace when a cohort weakens#
When retention drops, trace it with the signals you already instrument and line them up by the same cohort:
- NPS by cohort or segment: stable overall scores can hide movement inside a specific onboarding month or customer group. Check whether promoter, passive, and detractor mix shifted in the affected cohort.
- CSAT at key journey moments: compare CSAT around success and failure points to isolate where friction is likely occurring.
- Operational exception signals: look for payment failures, service disruptions, and related issues that can drive involuntary churn.
Retention earns its place because it forces sentiment signals to line up with actual customer behavior.
The tradeoff and the decision rule#
Retention is a lagging signal by definition, so problems may already be expensive by the time a cohort declines. Use it to confirm early warnings, not to replace them.
If NPS is stable but retention falls, widen the diagnosis before assigning a single cause. Check product dissatisfaction and pricing-value issues alongside payment failures, service disruptions, and other involuntary churn drivers. That avoids a late, survey-only diagnosis.
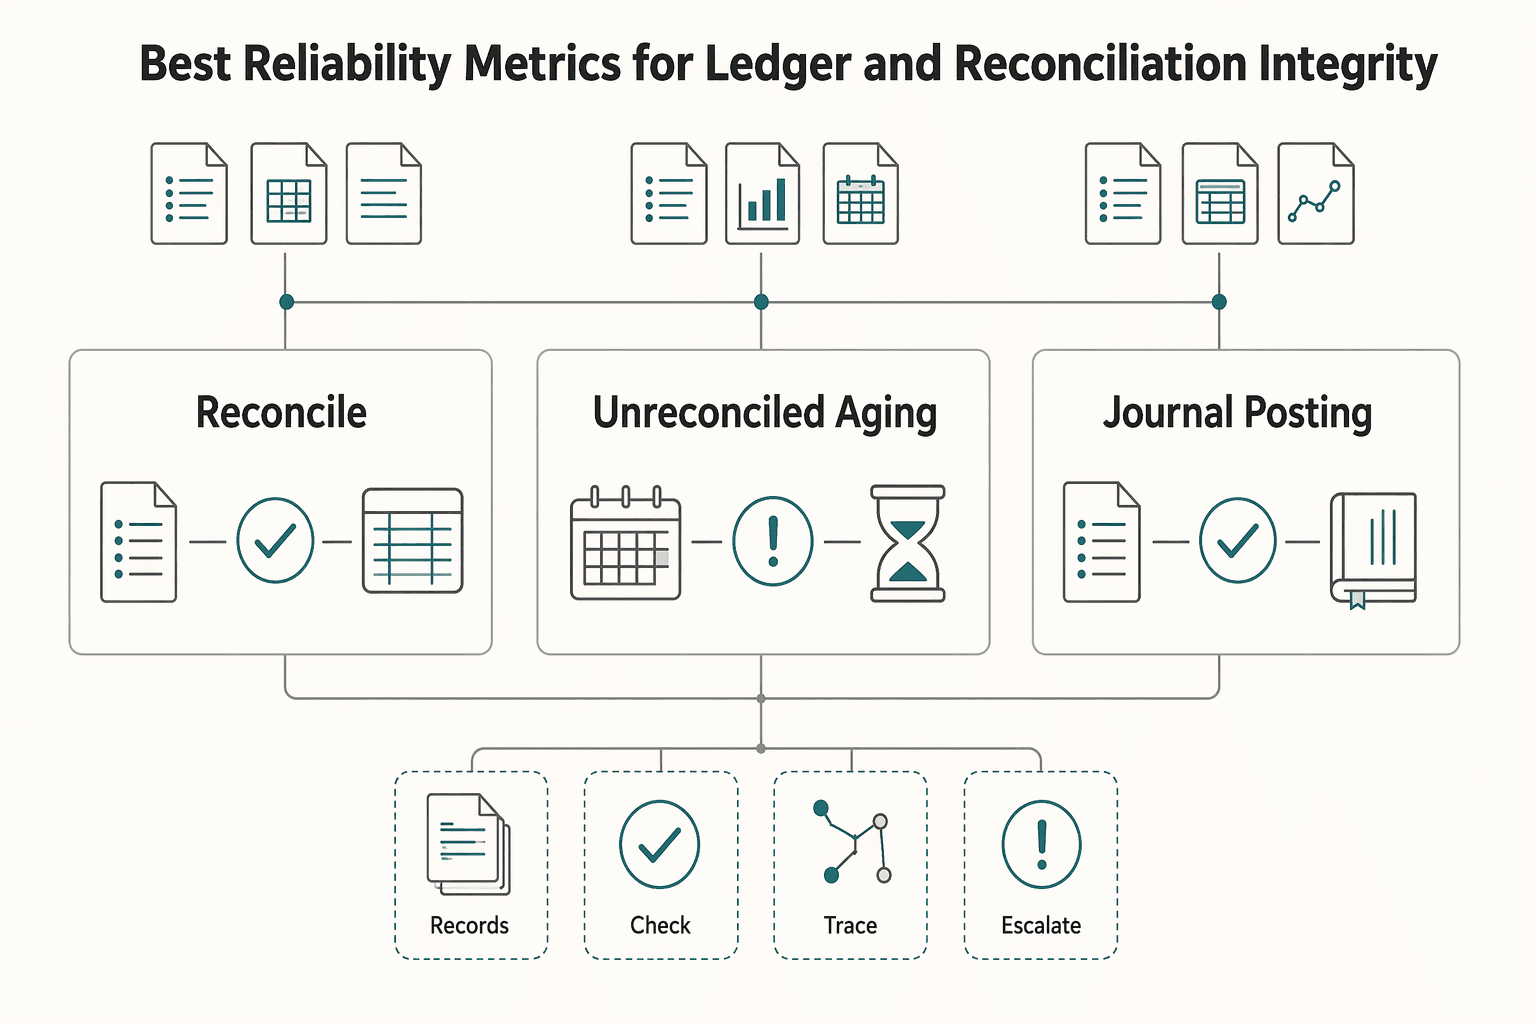
Best reliability metrics for ledger and reconciliation integrity#
The clearest reliability view for ledger integrity is a three-part check: match rate, unreconciled aging, and journal posting completeness in the books.
| Metric | Use | Review focus |
|---|---|---|
| Reconciliation match rate | Fast correctness signal | Compare internal records with external statements or subsidiary ledgers; review weekly, split unmatched items by source system, and check whether matching logic changed or key fields are missing. |
| Unreconciled aging | Open matching items resolved on time | Run a weekly checkpoint with owner, due date, status, blocker, and resolution path for each item, then escalate unresolved items based on your close timeline. |
| Journal posting completeness | Backstop for complete and accurate journal-entry population | Reconcile source-event totals, the journal population extract, and posted totals together; preserve the exact extract used for testing. |
These metrics are control-oriented and can support month-end confidence in operations. The tradeoff is scope. They can look healthy while customer frustration is building, so read them alongside CSAT and NPS, not as substitutes. NPS, reported from -100 to +100, and CSAT, often captured on a 1 to 5 scale, reflect sentiment; on their own, they do not confirm that records are complete and accurate.
- Reconciliation match rate
Use this as a fast correctness signal: how much of the population matches when internal records are compared with external statements or subsidiary ledgers. Because this process is meant to identify and resolve discrepancies, a drop should trigger a record-accuracy review. Review weekly, split unmatched items by source system, and check whether matching logic changed or key fields are missing.
- Unreconciled aging
Use aging to see whether open matching items are being resolved on time, not just identified. Open-item aging, based on lateness, due dates, and workflow status, gives a direct control view of unresolved backlog. Run a weekly checkpoint with owner, due date, status, blocker, and resolution path for each item, then escalate unresolved items based on your close timeline.
- Journal posting completeness
Treat this as the backstop: confirm that the journal-entry population used for review is complete and accurate, not just that posted entries look reasonable. In practice, reconcile source-event totals, the journal population extract, and posted totals together. Preserve the exact extract used for testing, because incomplete populations can obscure omitted or unauthorized entries.
If match quality drops while NPS stays flat, do not treat the flat score as proof that nothing is wrong. Treat it as a signal to verify record and timing exposure first, then communicate early when balances, timing, or corrections could affect customers.
Best execution metrics for settlement speed and payout reliability#
For Payout Execution, use settlement SLA attainment, payout success rate, and retry recovery as your primary control set. They show whether money moved on time and arrived. Track them next to Customer Satisfaction Score (CSAT) and Customer Retention so you can catch cases where operational performance improves while customer experience worsens.
| Metric | Measures | Key fields |
|---|---|---|
| Settlement SLA attainment | How often funds settle inside the promised window | Promised settlement timestamp, actual settled timestamp, and latest visible status transition. |
| Payout success rate | Completed payouts out of payout attempts | Failure reasons or refusal codes, including technical failures, incorrect destination details, and compliance or account-information holds. |
| Retry recovery | How many initially failed payments later succeed through retries | Attempt number, retry rule, recovery date, and final outcome. |
Settlement SLA attainment#
Settlement SLA attainment shows how often funds settle inside the promised window. It is a core speed-and-reliability metric because it makes the promised window explicit for each payment flow instead of relying on blended averages.
For instant-payment rails, treat settlement certainty differently from standard delayed payout flows. On RTP, settlement is final and irrevocable. Also keep onboarding behavior out of steady-state reporting. Stripe notes an initial payout is typically scheduled 7 to 14 days after a first successful live payment, which should not be mixed into recurring SLA performance.
At review time, check three fields on each breach: promised settlement timestamp, actual settled timestamp, and latest visible status transition. This keeps a strong overall rate from hiding localized problems.
Payout success rate#
Payout success rate measures completed payouts out of payout attempts, not just queued payouts. It can be an early operational signal for support pressure.
Go beyond pass or fail. Segment outcomes using failure reasons or refusal codes, including technical failures, incorrect destination details, and compliance or account-information holds. Stripe Express surfaces payout failure reasons in Dashboard. Stripe says most failed payouts come from incorrect bank details, and payouts can be paused when required tax-status information is missing. Those paths require different fixes and should be reported separately.
For failed or paused batches, preserve a compact evidence set: provider status export, failure reason or code, account-requirement state, customer notification timestamp, and owner. If you ignore paused payouts, you understate customer-visible delay risk.
Retry recovery#
Retry recovery tracks how many initially failed payments later succeed through retries. It separates permanent failures from timing-related failures and helps you judge whether retry policy is working.
Stripe Smart Retries recommends 8 tries within 2 weeks. Adyen recommends retry logic for refused payments, with Auto Rescue configurable from 1 to 48 days and 30 days recommended. More retries can improve recovery, but they can also extend uncertainty if status messaging is weak.
Track attempt number, retry rule, recovery date, and final outcome. If first-attempt failures rise while recovery remains strong, the issue may be transient. If failures rise and recovery drops together, check destination-detail quality and compliance gating first.
Broken or failed payments are not a side metric. Stripe reports 47% (2023) of surveyed businesses said failed payments severely impact customer retention. Keep one final guardrail in place. If execution rates improve but CSAT softens, review payout-status clarity and delay messaging, since poor payout transparency is tied to higher support-call volume.
Signal conflict rules that prevent bad decisions#
When sentiment and operations disagree, do not trust any single metric in isolation. Use customer signals for impact and operational signals for what actually happened.
| Scenario | Risk | Check first |
|---|---|---|
| High NPS, falling retention | A strong Net Promoter Score can coexist with customer loss | Compare survey respondents and retained customers in consistent cohorts instead of relying on blended averages. |
| High CSAT, rising reconciliation exceptions | High CSAT does not rule out operational risk | Review the source transaction record, journal or accounting entry, exception reason, opened date, and current owner. |
| Better payout execution, worse NPS | Improved payout success does not automatically mean improved trust | Review communication quality, status clarity, and long-tail delay handling before calling it a clean win. |
| Ledger first, Settlement second, CX third | Interpretation should follow verified operations | Verify transaction and accounting alignment and discrepancy aging first, validate promised versus actual settlement status and finality next, then read CSAT, NPS, and retention. |
- High NPS, falling retention
A strong Net Promoter Score can coexist with customer loss. NPS reflects recommendation intent from a 0 to 10 question, reported on a -100 to +100 scale, while retention shows whether customers actually stay.
If NPS is high while retention declines, treat segmentation or value-delivery as a working hypothesis, not a conclusion. Compare survey respondents and retained customers in consistent cohorts instead of relying on blended averages.
- High CSAT, rising reconciliation exceptions
High CSAT does not rule out operational risk. CSAT captures a reaction to a specific interaction, while matching checks whether transaction records align with accounting records and flags discrepancies.
If CSAT stays strong while exceptions rise, treat survey timing bias as possible and escalate reconciliation controls. Review a compact evidence set for key exceptions: source transaction record, journal or accounting entry, exception reason, opened date, and current owner.
- Better payout execution, worse NPS
Improved payout success does not automatically mean improved trust. You can reduce outright failures and still see friction across the payment journey.
If execution improves while NPS drops, review communication quality, status clarity, and long-tail delay handling before calling it a clean win. Use this in context with retention risk, especially since surveyed businesses report broken or failed payments can have a severe impact on retention.
- Use a fixed internal triage order when signals conflict
Use one internal order consistently so interpretation follows verified operations. A practical sequence is Ledger first, Settlement second, CX third.
In practice, verify transaction and accounting alignment and discrepancy aging first. Validate promised versus actual settlement status and finality next. Then read CX severity with CSAT for touchpoint experience and NPS and retention for broader loyalty risk. This keeps a positive survey from overruling a finance-control issue.
For adjacent pricing context, see How Payment Platforms Really Price FX Markup and Exchange Rate Spread. You can turn these triage rules into repeatable runbooks with idempotent retries and traceable status events in the Gruv docs.
Governance rhythm and evidence pack for weekly metric reviews#
If you run this as a weekly review, each metric movement should leave the meeting with three things: a named owner, auditable evidence, and a decision deadline.
- Assign owners by control layer
One workable split is finance for Ledger and Reconciliation, ops for Settlement and Payout Execution, and product for Net Promoter Score (NPS) and Customer Satisfaction Score (CSAT) instrumentation. This is an operating choice, not an industry standard, but it helps keep the books, money movement, and survey quality from collapsing into one team's narrative.
Ownership should map to evidence depth. Finance should show journal and matching proof behind exception trends. Ops should explain timing or payout breaches with operational detail. Product should verify survey timing and segment logic so a well-timed score is not confused with real operational health.
- Standardize one auditable evidence pack
Use the same core pack each week: NPS, CSAT, Customer Retention, exception logs, aging of open items, and timing breach counts. For retention, keep the base formula consistent: (customers you end with - new customers)/customers you started with, then segment by cohort or corridor instead of relying on one blended line.
For payout issues, include a drill-down from summary amounts to transaction-level evidence. Treat payouts as batches for matching, and review failed payouts as a separate signal. If you use automatic payouts, preserve transaction-to-payout linkage so later reconciliation stays traceable.
Keep missing-money checkpoints explicit. If an expected payout has not landed after 10 business days, record Trace ID status, bank-contact ownership, and follow-up owner. If a payout is returned, track that separately. Payouts are typically returned within 2-3 business days.
- Use named, time-bound escalation triggers
Do not watch and wait when reliability and sentiment deteriorate together. Trigger escalation when customer signals and operational signals move on the same segment, then assign one responder per layer with a decision deadline.
Time-bound ownership matters: if an incident is not acknowledged before the escalation timeout, escalate to the next response level. Clear roles reduce duplicate work and missed handoffs between finance and ops.
Keep triggers tied to customer impact, not internal-only noise. If timing or payout outcomes worsen and sentiment also drops, route the incident immediately instead of waiting for month-end.
- Use periodic calibration as a cleanup pass
If you run a periodic calibration pass, use it to remove metrics that do not drive action. Keep core measures that trigger concrete work: clearing unreconciled aging, investigating failed payouts, fixing instrumentation, or resolving timing breaches.
Treat high-level averages without segmentation, ownership, or an evidence trail as weak governance signals. A smaller set of action-linked metrics is more useful, especially for teams targeting outcomes like 100% same-day cash reconciliation with human oversight.
Final check: CX metrics should stay tied to verifiable operations evidence, and finance controls should not crowd out customer signals. The goal is one shared evidence set before a bad week turns into retention loss.
Common metric mistakes that create false confidence#
Even with a solid weekly evidence pack, clean dashboard averages can still create false confidence. The most common mistakes are interpretive, and they are avoidable.
- Using NPS as a standalone health score
Net Promoter Score (NPS) is one recommendation question on a 0 to 10 scale, calculated as promoters (9-10) minus detractors (0-6). It is useful, but not sufficient on its own. Qualtrics recommends tracking multiple customer-experience metrics, and academic summaries have criticized NPS cutoffs and excluded sample portions.
Review NPS alongside other customer and payment metrics. If NPS is steady while acceptance rates worsen or failure patterns increase, treat the score as incomplete.
- Reporting one blended average across all flows
Blended reporting hides where payment outcomes are actually failing. NPS can be tracked by segment, geography, or function, and Stripe recommends slicing payment analytics by dimensions like brand, country, or input method while checking where and why payments fail.
In practice, segment by geography, payment input method, and failure cause. If a negative movement cannot be traced to a segment and failure diagnostics, the average is too blended to drive action.
- Ignoring the respondent mix behind the score
A flat top-line NPS can still mask shifts in underlying responses because passives are removed in the formula. Passives (7-8) are somewhat satisfied but can switch.
Do not stop at the -100 to 100 index. Review promoters, passives, and detractors by segment, using raw bucket counts alongside the final score.
- Copying generic vendor guidance into payment ops without adaptation
Qualtrics, Medallia, and Vitally are broad by design, and Vitally explicitly frames success metrics as custom KPIs from your own data. Their defaults are not a payment-specific standard.
Before you trust dashboards, confirm your survey definitions and segment fields map to your own operational data and reporting logic.
- Treating sparse public claims as true benchmarks
Self-published results are context, not strong benchmarking. For example, ConnexPay's October 2, 2025 post reports an NPS of 60 from 267 respondents, which is a single-company data point.
Use claims like this as directional context only, then benchmark against your own segmented baseline and operational outcomes instead.
Build a metric system that tells you what to fix next#
Build a ranked metric stack, not a scoreboard. Use NPS, CSAT, and retention as customer signals, then tie each one to verifiable transaction records, matching evidence, settlement data, and payout-execution evidence so the next fix is clear.
Start narrow with five measures: NPS, event-level CSAT, customer retention rate, matching quality, and payout status outcomes. Assign clear ownership, and set a triage rule you can apply consistently: when customer sentiment and operational evidence conflict, start by investigating the records.
- NPS for directional trust
Use NPS as a relationship signal, not a root-cause tool. Track promoters (9 or 10) and detractors (0 to 6) by segment instead of relying on one blended average. When detractors rise in a segment, check payout failures or returns, matching exceptions, and timing delays in that same segment.
- CSAT for moment-level friction
Use CSAT to measure satisfaction with a specific event. Tie each survey to the exact event and timestamp so you can compare sentiment with payout and timing outcomes. CSAT is a short-horizon signal, so treat it as an early indicator, not the final outcome.
- Retention for outcome truth
Use retention to confirm whether improvements actually keep customers over time. Calculate it consistently with CRR = ((E-N)/S) x 100, and review by cohort, not only at company level. If NPS or CSAT improves while retention weakens, treat that as a diagnosis gap and trace it back to operational evidence.
- Operational checks in reconciliation, settlement, and payout execution
For reconciliation, confirm payout-to-bank-deposit matching. For settlement, use transaction-level evidence, for example settlement details, and batch-level views when needed. For payout execution, monitor processing, posted, failed, returned, and canceled. Returned payouts are typically returned within 2-3 business days, so include that lag in your review cadence.
Keep the weekly pack simple and auditable: NPS by segment, CSAT by event, retention by cohort, open-item aging, timing exceptions, and payout status counts. If a detractor, low CSAT response, or retention drop cannot be traced to an account, event time, and operational record, you still have disconnected charts, not a usable metric system. If your next step is tightening settlement and failure visibility, evaluate how Gruv Payouts can support that operating model.
Frequently Asked Questions
Is Net Promoter Score enough for payment platforms?
No. NPS is a loyalty signal on a -100 to +100 scale (Promoters% - Detractors%, where 9-10 are promoters, 7-8 passives, and 6 or less detractors), but it is not enough to diagnose payment operations on its own. Pair it with payout and settlement operational evidence so you can see where failures occur. If NPS stays stable while failed payouts rise, treat the operational signal as an incident trigger.
How should finance and ops teams combine NPS, CSAT, and retention in one dashboard?
Put experience and operations signals in one view, not separate tabs. A practical layout is segmented NPS trend, event-level CSAT on a 1 to 5 scale, retention using [(E - N) / S] × 100, and then settlement timing plus payout status outcomes. Keep each metric traceable to a specific event, segment, or exception class rather than one blended average.
What should trigger an operational investigation even if NPS still looks healthy?
Hard failure states should trigger investigation immediately. A failed payout is an incident even with stable NPS because the bank could not receive the payout and funds were sent back. In payout monitoring, triage by status (processing, posted, failed, returned, canceled) and investigate status shifts and settlement timing around batch closes.
Which metrics belong to finance owners versus payments ops owners?
There is no universal ownership split, so assign ownership to the team that can verify and correct the issue fastest. In practice, align owners to the signals they can directly act on, such as payout status handling versus settlement reconciliation review. NPS and CSAT signals should still map back to operational evidence so experience signals and operational data can be investigated together.
How often should we review settlement and payout metrics against customer feedback metrics?
Use the cadence of your payout and settlement mechanics, not a generic calendar. Settlement reconciliation follows batch close timing, and for Adyen the Settlement Details report is generated 2 hours after the payable closing time, so checkpoints should align to that cycle. Review more frequently during incidents, especially when payout returns can surface in 2-3 business days, and review when batch closes or payout statuses shift.
What do we do when CSAT and retention point in opposite directions?
Treat it as a diagnosis issue, not a scorecard contradiction. CSAT reflects event-level satisfaction, while retention reflects longer-horizon behavior, so divergence can indicate that the surveyed interaction and longer-term outcomes are not moving together. Check survey event design first, then segment retention by relevant cohorts and compare both against payout failures and delays; for deeper retention framing, use what payment experience metrics actually predict retention.
Try a related tool
Researched and edited by the Gruv editorial team. Gruv builds cross-border billing, payouts, and finance-operations software for global businesses.
Sources
Includes 1 external source outside the trusted-domain allowlist.
- comptrollerofthecurrency.gov/publications-and-resources/publications/bank...trusted
- docs.stripe.com/reports/payout-reconciliationtrusted
- federalreserve.gov/paymentsystems/files/psr_policy.pdftrusted
- federalreserve.gov/paymentsystems/fedfunds_about.htmtrusted
- sloanreview.mit.edu/article/a-smarter-approach-to-measuring-cust...trusted
- stripe.com/resources/more/payment-kpis-metrics-that-rev...trusted
- stripe.com/resources/more/payment-reconciliation-101trusted
- connexpay.com/resources/blog/industry-leading-nps-score-of...external
Educational content only. Not legal, tax, or financial advice.
Related Posts

The Freelance Payment Penalty: A Modeled Audit of Platform Fees, FX Spreads, and Payout Delays
The money rarely disappears through a single, easy-to-spot fee. The real loss is stacked. A marketplace takes its commission, a processor adds a charge for international cards, a bank or payment company converts the currency at a spread, a platform holds the funds before release, and a wire sheds a little to intermediaries on the way in. Each layer looks defensible on its own, but the worker feels the combined result as a smaller deposit and a later payday.

How to Respond to a Subpoena for Business Records
Move fast, but do not produce records on instinct. If you need to **respond to a subpoena for business records**, your immediate job is to control deadlines, preserve records, and make any later production defensible.

A US Expat's Guide to Investing in UCITS ETFs to Avoid PFIC Issues
The real problem is a two-system conflict. U.S. tax treatment can punish the wrong fund choice, while local product-access constraints can block the funds you want to buy in the first place. For **us expat ucits etfs**, the practical question is not "Which product is best?" It is "What can I access, report, and keep doing every year without guessing?" Use this four-part filter before any trade: