
Quick Answer
Separate merchant processing costs from distribution take rates first, then benchmark each market with tagged fee lines, documented unknowns, and a 90-day validation gate. For platform payment fee benchmarks, treat published ranges like 1.5% to 3.5% as directional until quotes show pricing model, plan tier, channel context, and component detail such as interchange, network fees, and markup. Commit expansion only after live results stay inside your variance limits and reconciliation, payout, and compliance checks are passing.
Use fee benchmarks as inputs, not pricing truth#
Payment fee benchmarks help only when you keep verified inputs separate from model-dependent assumptions. Use them to sort options, not to lock pricing before you know how your program will actually run.
Early models can break when teams roll different cost categories into one number and treat it like a commitment. Keep each benchmark tied to its assumptions so a directional estimate does not become false certainty.
| Category | What you can use now | What stays provisional |
|---|---|---|
| Merchant processing inputs | Quoted processing rates, plan terms, payment-lane pricing | Your actual fee mix after launch |
| Platform/distribution economics | Stated take-rate assumptions | Realized take rates by market/model |
| Rollout constraints | Known launch requirements | Constraints that change by lane, plan, or scale |
What you can measure right now#
Start with concrete processing inputs. One published benchmark places typical credit card processing costs at 1.5% to 3.5% per transaction. Use that range carefully, because actual results vary by industry, transaction volume, and payment method.
| Payment lane | Published rate | Plan |
|---|---|---|
| tap, dip, or swipe card-present payments | 2.6% + 15¢ | Square's Free plan |
| online card payments and invoices | 3.3% + 30¢ | Square's Free plan |
| manual entry or card on file | 3.5% + 15¢ | Square's Free plan |
Benchmark by payment lane, not with one blended figure. On Square's Free plan, tap, dip, or swipe card-present payments are 2.6% + 15¢. Online card payments and invoices are 3.3% + 30¢. Manual entry or card on file is 3.5% + 15¢.
If you use Square examples in a fee model, verify them on the live Square pricing page before sign-off. Treat any copied benchmark row as provisional until the current provider page, your expected payment lane mix, and your own support workload all line up.
What stays unknown until you define the model#
One key unknown is which fee stack your platform will trigger most of the time. Interchange fees are a major part of processing cost, and they vary by card network and card type.
Plan context changes the outcome too. Square notes that fees vary by plan, and merchants processing over $250,000 per year can discuss custom pricing. If your margin model depends on negotiated pricing, keep that assumption provisional until your expected volume and profile are validated.
Also record source freshness and scope. If a benchmark source is dated January 2, 2025, log that date and treat the figures as directional when lane definitions, plan detail, or payment-method context are incomplete.
What this article helps you decide#
This article separates three decisions that often get mixed together: merchant processing costs, platform or distribution take rates, and rollout constraints. The goal is simple: give you comparison criteria, verification checks, and a launch sequence that keeps unknowns visible until they are validated.
If you want a deeper dive, read Churn Rate Benchmarks by Industry: What Payment Platforms Should Expect and Target.
Define the benchmark types before comparing anything#
Start by fixing the taxonomy. Available benchmarking data is general (compensation/product), not payment-fee-specific, so use it to set process guardrails. Treat payment-fee category labels as hypotheses until you validate them separately. Before you compare any numbers, require a basic evidence record for each bucket:
- benchmark category
- comparator market
- data source(s)
- source date
- whether the benchmark is internal or external
Use the same method every time. That consistency is what makes benchmark outputs credible. Common failures come from skipped steps, shortcut assumptions, or overreliance on a single source.
Label the benchmark type clearly as well. External benchmarking compares you to outside entities, while internal benchmarking compares current performance to your own past results.
Your first checkpoint is straightforward: which category is constraining expansion, and is that category definition evidence-backed? If that answer is fuzzy, fix the taxonomy before you make pricing or rollout decisions.
You might also find this useful: Gig Economy Payment Trends 2026 for Platform Operators.
Build the fee stack from transaction to margin#
Reliable margin work starts with a line-by-line fee stack. Separate mostly pass-through costs from negotiable commercial terms. In most card flows, interchange is the largest component; processor markup is usually where the commercial movement happens.
A card transaction is a chain, not one fee. The flow runs from customer to payment processor, then card network, issuing bank, acquiring bank, and merchant. Each participant can add cost, which is why a single displayed rate often hides the structure underneath.
| Bucket | Paid to | Practical meaning |
|---|---|---|
| Interchange fee | Issuing bank | Typically the largest component, and it varies by card type |
| Network fee | Card network | Network-level charge inside the transaction stack |
| Processor markup | Processor or PSP | The provider margin layered on top of pass-through costs |
A blended headline rate can still be useful, but it is only a bundle. For example, 2.9% + $0.30 does not tell you how much goes to the issuing bank, network, or processor.
Interchange often drives most of total cost. One source-scoped example cites US consumer credit card interchange around 1.5%-2.1%. That shows how card mix can move effective cost before PSP margin is applied. Keep network and card-type assumptions visible in your model instead of collapsing everything into one average too soon.
Negotiation usually sits in markup, not interchange. If a provider offers a lower total rate, check whether markup actually changed or whether the quoted card-mix assumptions changed.
Before you approve any benchmark assumption, tag each quote line item as interchange, network fee, or markup. If you cannot tag a line item, treat the quote as incomplete and keep the benchmark provisional.
Related reading: Prepare Your Payment Platform for Acquisition: Compliance, Technical, and Financial Readiness.
Establish realistic baseline ranges and known unknowns#
Outside numbers help only when the source is clear about method, scope, and what fee it is actually measuring. Most estimates should stay provisional, and final pricing commitments should wait until the unknowns are resolved.
One excerpt explicitly calls out "1. Methodology and Prior Literature." That is a good minimum comparability checkpoint. Without equivalent method detail, you cannot tell whether a source is discussing merchant processing, broader retail payment costs, a different business model, or a pricing narrative that only looks comparable. The table below shows what current sources support and what remains unknown for decision-grade benchmarking.
Knowns and unknowns#
| Source excerpt | Benchmark type known | Geography scope stated | Covered entities stated | Missing methodology fields |
|---|---|---|---|---|
| Harvard JOLT article, Fall 2023 | Pricing-behavior caution, not a direct merchant fee benchmark | Not stated in the supplied excerpt for payment-fee use | Card-network coverage is not established in the supplied excerpt | The supplied excerpt does not establish fee-component definitions, sample, merchant segment, or processing-benchmark calculation method |
| World Bank guide title extract | A guide for measuring retail payment costs exists | Not discernible from the title-only extract | Not stated | Title only; operative method, entities covered, and benchmark assumptions are unknown |
| SEC Form S-4, filed June 22, 2011 | Corporate registration statement, non-marketplace-fee context | Not usable as a payment-benchmark geography field | Not stated | No comparable fee methodology or processing-benchmark scope in the supplied excerpt; age requires freshness review |
| PMC-hosted paper, available 2018 Dec 1 | Provenance caution only from the supplied excerpt | Not a marketplace-fee geography benchmark in the supplied text | Not stated | The supplied excerpt does not provide fee definitions or benchmark method; database inclusion is not quality validation |
| Medium article dated May 25, 2025 | A dated Medium article is provided, but not a verified fee benchmark from the supplied text | Not stated | Not stated | The supplied extract does not provide definitions, sample, channel scope, or fee-component breakdown |
From available data alone, you cannot produce a final benchmark number. If geography, covered entities, or method are unstated, treat them as unknown.
Where comparability breaks#
- Source purpose: different sources are not interchangeable benchmark evidence.
- Freshness: dates like "June 22, 2011" and "2018 Dec 1" are obvious recency checkpoints before you use figures for current pricing.
- Provenance: "Inclusion in an NLM database does not imply endorsement" is a direct reminder that hosting is not validation.
- Hidden assumptions: the "pricing paradox" warning applies here too. A clean headline can hide assumptions that change the result.
Caveat you should make explicit#
Caveat
The available evidence does not support apples-to-apples comparison for marketplace payment-fee benchmarking. Use these sources to define evidence requirements and unknowns, not to set a final benchmark or quote a market-standard rate.
What to do before you commit a number#
If you need to carry an estimate forward, mark it provisional whenever any of the following is missing:
- stated methodology or calculation note
- geography and merchant-segment scope
- covered entities, or an explicit statement that entity scope is not specified
- fee-category definition showing what is included and excluded
Do not make a final pricing commitment until those unknowns are resolved in writing. At minimum, your evidence pack should log source URL, date, benchmark type, stated geography, whether covered entities are actually named, and every missing methodology field. Related: Payment Decline Rate Benchmarks: How Your Platform Compares to Industry Standards.
Normalize by market context before cross-country decisions#
Cross-country comparisons break quickly when you use headline fees without context. Normalize each option for operating conditions first. The material here shows cross-border adoption depends on infrastructure, regulation, and cultural attitudes. Fragmented infrastructure, low transparency and high friction, compliance drag, and FX risk can change the real economics even when quoted rates look similar.
Build one normalization table before ranking markets#
Use one country or program sheet and require these fields before you rank anything.
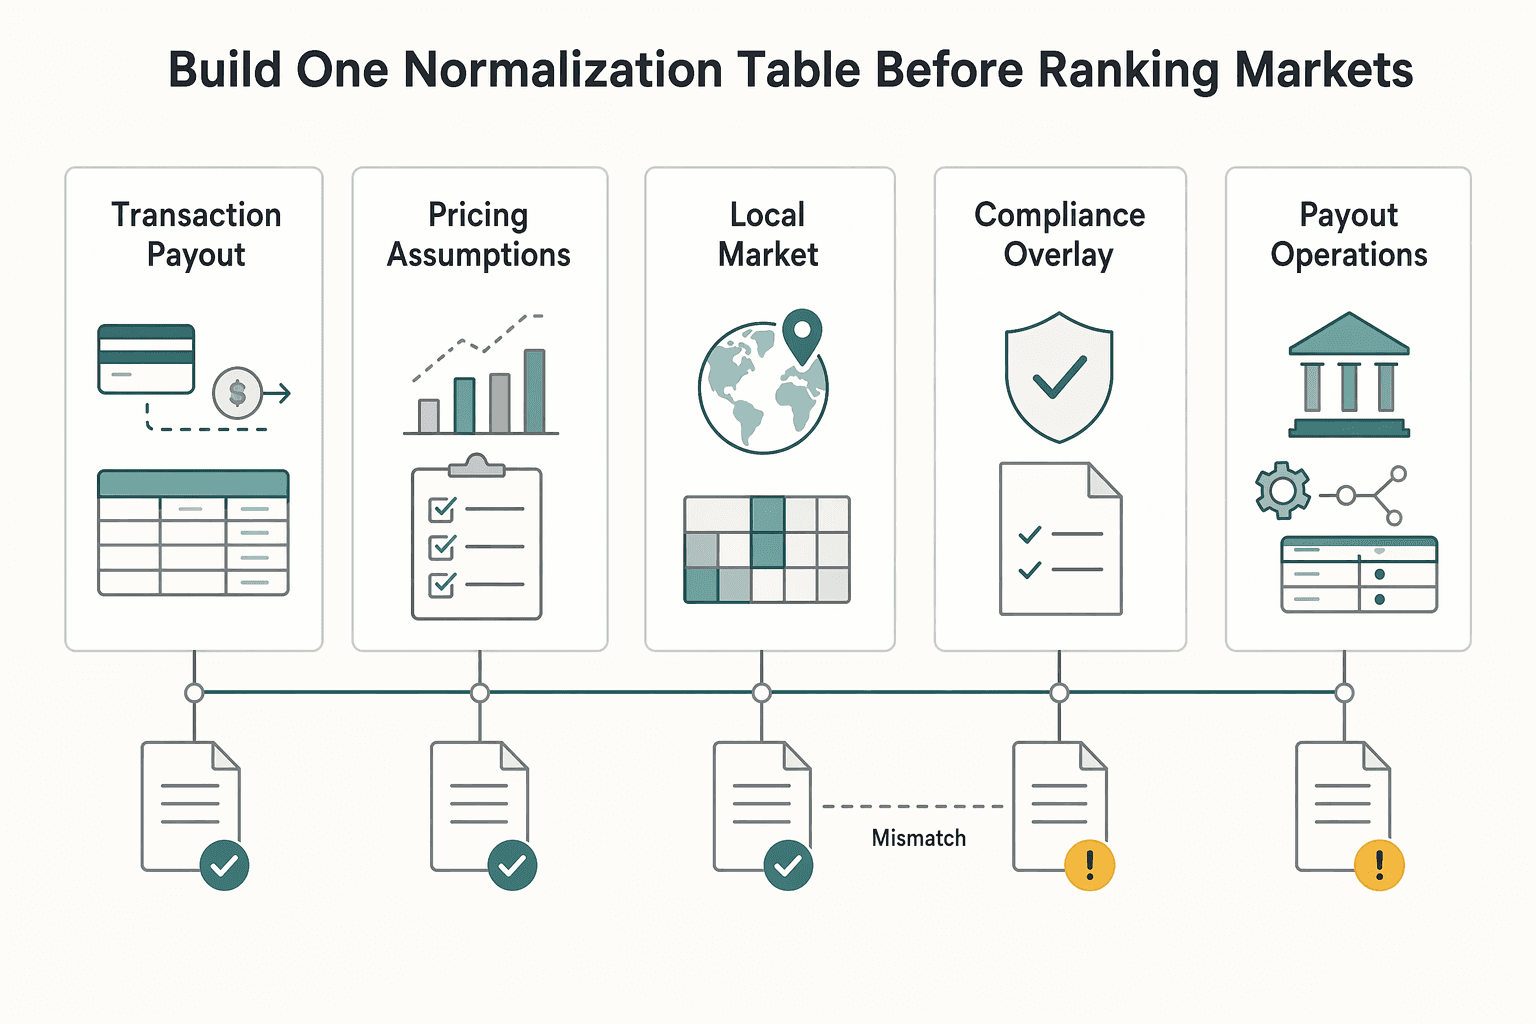
| Field | Record for each country/program | Why it matters |
|---|---|---|
| Transaction and payout flow | Payment flow and payout path (domestic vs cross-border) | Keeps flow differences visible instead of blending them into one headline rate |
| Pricing assumptions | Quoted pricing assumptions, quote date, and unknowns | Prevents comparing blended numbers built on different assumptions |
| Local market and infrastructure behavior | Known market or infrastructure behavior notes | Flags where similar quotes may run differently in practice |
| Compliance overlay | Key compliance requirements and validation steps for the program | Captures compliance burden as part of economics, not a later workstream |
| Payout operations overlay | Payout operations scope, ownership, and handoffs | Surfaces operational workload early |
| Operating risk notes | Fragmentation, transparency and friction, FX exposure, and centralization approach | Makes operating risk explicit in the decision |
Add an adoption lens so comparisons stay apples-to-apples#
The CPAI framework is useful here because it compares maturity across technological, regulatory, institutional, and cultural dimensions, and the study identifies four archetypes: digital pioneers, regulatory harmonizers, institutional trust builders, and hybrid adopters. Use those archetypes as context, not as a standalone score.
Tie-break close fee quotes with operational friction#
When two markets have similar headline rates, prioritize the one with lower operating friction, especially where compliance and payout operations are clearer to run. That keeps your benchmark work tied to an actual launch decision instead of a rate-only comparison. Need the full breakdown? Read How to Hire a CFO for Your Payment Platform.
Pick a pricing model that matches transaction reality#
Pick the pricing model your transaction data and operations can support, not the one that looks best in a headline quote. Compare options against your own settlement flow and full cost stack, then choose the one that holds up in your unit economics.
Marketplace payments run through a settlement flow, not a single fee event, so model the full cost stack before you choose. In practice, that means checking how authorization and capture, fee deductions, splits, tax handling, payouts, and reversals affect unit economics.
Use the model that fits your operating shape#
| Pricing model | Usually fits when | Verify first | Common downside |
|---|---|---|---|
flat-rate pricing | You want more predictable transaction-level pricing | The quoted rate still matches your basket structure and payout pattern | Costs can be higher than expected for some mixes |
interchange-plus pricing | You can operationally manage more fee detail | Your data captures percentage fees, fixed fees, and settlement-related charges across the flow | Added complexity can increase reconciliation effort |
| Either model with faster settlement | Cash timing or payout speed is a priority | Whether faster/same-day settlement adds surcharge cost versus a 2-3-day standard cycle | Faster cash movement can worsen unit economics |
Stress-test both models against basket structure, payouts, and risk instead of using one blended assumption. Public ranges like 1.5%-3% MDR/TDR or rough processor quotes around 2-3.5% + fixed fee are useful context, but they are not enough on their own for marketplace model selection.
The failure mode to avoid is choosing from generic averages without mapping your actual settlement sequence. As volume grows, per-transaction fees matter more, and fixed fees can weigh more heavily on lower-ticket flows. In thin-margin cases, payment-layer deductions can materially compress what you keep.
Keep merchant costs and distribution take rates in separate P&Ls#
This is where many models go wrong. Do not use one blended benchmark for expansion decisions. Keep merchant acceptance costs (acquirer/network fee deductions, processor markup, plus any scoped payout/gateway costs) in one lane, and keep distribution takes (channel/store take rates plus channel-specific commercial deductions or mandates) in another.
| View | Include | Use it to answer |
|---|---|---|
| Merchant acceptance P&L | acquirer/network fee deductions, processor markup, and any payout/gateway costs you intentionally scope in | Can this payment flow work on its own economics? |
| Distribution P&L | Channel/store take rate plus channel-specific commercial deductions or mandates | Is this route to market commercially viable? |
| Intersection view | Order- or SKU-level margin after both lanes hit the same transaction | What margin actually survives by channel and market? |
This split matters because marketplace payments are a settlement flow, not a single fee event. The chain runs through authorization and capture, acquirer and network fee deductions, then vendor-platform split, payout, tax handling, and possible reversals. Distribution costs vary by platform and can change margin for the same SKU.
Use one checkpoint before you approve a market model: every quoted line item must be tagged to a lane. If a fee cannot be classified, treat the estimate as provisional. Then review profitability per order, per SKU, and per channel on a frequent cadence, daily where possible, so order-level leakage is visible before it disappears into a monthly P&L.
The main failure mode is publishing one "all-in" number and using it as a planning input. Blended reporting can hide what is channel-driven and what belongs to payment operations. In a sample order waterfall, 2.9% platform fees and 3.3% payment processing are separate lines. Combining them removes ownership and hides the fix.
Price compliance and tax operations as first-class cost drivers#
Once you split acceptance and distribution P&Ls, add a third gate: trust the economics only if compliance and tax operations are clear enough to support launch timing. If KYC, KYB, AML, or tax handling is still unresolved, the benchmark is still provisional.
Do not assume compliance setup is free just because the quote is silent. Carry KYC/KYB/AML costs, timelines, and control requirements as named unknowns with an owner, decision date, and launch dependency. If two markets look similar on payment economics, prioritize the one with fewer unresolved onboarding and tax assumptions.
Treat tax operations as launch logic, not back-office cleanup#
Treat tax operations as launch logic through eligibility, reporting, and timing checkpoints. Keep specific VAT thresholds and filing rules for W-8, W-9, FBAR, and Form 1099 as explicit unknowns rather than assumptions presented as fact.
FEIE is a good example. Even when a taxpayer qualifies, they still file a U.S. return reporting the income. The IRS also states the exclusion is applied to the year the income is earned, even if cash is received later. If payouts or accruals cross year boundaries, that timing can affect planning.
Use hard checkpoints for FEIE assumptions#
If FEIE is part of your operating model, the physical presence test is a hard checkpoint: 330 full days in foreign country or countries during 12 consecutive months. Those days do not need to be consecutive, but a full day is 24 consecutive hours from midnight to midnight. Days abroad are countable only when the tax home is in a foreign country.
| Checkpoint | Stated rule |
|---|---|
| Physical presence test | 330 full days in foreign country or countries during 12 consecutive months |
| Day pattern | Those days do not need to be consecutive |
| Full day definition | 24 consecutive hours from midnight to midnight |
| Countable days | Days abroad are countable only when the tax home is in a foreign country |
| Missed threshold | Missing the 330-day threshold fails the test regardless of reason, including illness, family issues, vacation, or employer orders |
| Waiver path | A waiver path may exist for war, civil unrest, or similar adverse conditions, but that is an exception path, not a default planning assumption |
Missing the 330-day threshold fails the test regardless of reason, including illness, family issues, vacation, or employer orders. A waiver path may exist for war, civil unrest, or similar adverse conditions, but that is an exception path, not a default planning assumption.
Define the evidence pack before launch#
Before go-live, require artifacts that make tax assumptions testable:
- A named owner and decision date for each unresolved tax/compliance assumption.
- A day-count method that can support the 330 full days checkpoint in a 12-month window.
- A documented filing/timing path showing income is still reported and allocated to the year earned.
If FEIE is in scope, define the filing path explicitly. IRS materials referenced here point to Form 2555 or Form 2555-EZ for claiming the exclusion, and the IRS practice unit that mentions these forms is not binding legal authority. Use it as a pointer, not the legal basis.
If compliance or tax operations can change launch assumptions, include that work in benchmark assumptions before launch. This pairs well with our guide on Finance Operations Priorities for Payment Platform CFOs.
Choose rails based on payout use case not generic fee averages#
If your real bottleneck is paying out sellers or contractors, do not choose rails from card-acceptance fee averages. Card networks solve acceptance. ACH and other payout rails handle disbursement. Blending those into one benchmark can hide the actual cost and risk center.
Card acceptance and bank payouts are different operating flows, and they can create different timing, exception handling, and reconciliation pressure. The OCC payment systems handbook treats card transaction and settlement flow separately from ACH transaction and settlement flow, and that matters in practice. Some marketplaces are acceptance-light but payout-heavy, and others are the reverse.
For contractor-heavy models, the payout side can drive day-to-day load. You can accept funds efficiently on card rails and still miss your operating target if payout timing, failure handling, or recipient-support volume is misaligned. In that case, acceptance pricing alone is not enough to make a decision.
Decide the operating target before the rail#
Pick the rail only after you define:
- Settlement speed target for recipients
- Failure tolerance when a payout does not complete as expected
- Reconciliation burden your finance, ops, and support teams can absorb
That sequence forces better tradeoffs than generic fee tables. Choose the rail that fits your payout promise, then evaluate pricing in that context.
Treat availability as a program question, not a universal feature#
Rail availability and behavior can vary by institution, program structure, and compliance configuration. Treat support claims as conditional, not universal. The OCC guidance frames risk as institution-specific, which is a practical reminder that implementation context matters.
So avoid broad assumptions like "we support ACH" as launch logic. Define scope explicitly: entity, launch geography, recipient type, and onboarding or compliance setup.
Verification checkpoint before launch geography is locked#
Before committing to a country or program, require written confirmation of:
- Exact rail support for your planned entity and recipient type
- Exception handling for failed, returned, held, or manually reviewed payouts
- Reconciliation artifacts for payout events and status changes
- Membership or provider dependencies that affect access, including formal checkpoints tied to payment-system participation such as 12 CFR 7.1026
This is not just a pricing decision; it is also an access, dependency, and control decision. If your team cannot clearly explain the exception path, keep the rail assumption provisional and delay final market sign-off.
Spot red flags that make benchmark data unusable#
Use only benchmark inputs you can compare and reproduce. If a source does not clearly state pricing model, cost layers, channel, and method, it is not decision-ready.
| Red flag | Article guidance |
|---|---|
| Missing pricing model | Treat any source as weak evidence if it does not state its pricing model and acceptance context |
| Hidden fee stack | Reject datasets that show only a headline total and hide the underlying cost components |
| Mixed ecosystems | Do not mix app-store distribution economics into merchant-acquiring benchmarks unless they are explicitly segmented |
| Stale or non-reproducible sources | Treat freshness and method as gate checks, not footnotes; if publication date, scope, covered entities, or methodology fields are missing, quarantine the dataset |
Missing pricing model#
Treat any source as weak evidence if it does not state its pricing model and acceptance context. Different models can package costs differently, so the same headline rate can reflect very different economics.
Hidden fee stack#
Reject datasets that show only a headline total and hide the underlying cost components. Without that breakdown, you cannot separate structural cost from negotiable markup or run like-for-like comparisons. If one source exposes determinant fields and another does not, you are comparing reporting styles, not market conditions.
Mixed ecosystems#
Do not mix app-store distribution economics into merchant-acquiring benchmarks unless they are explicitly segmented. App distribution and card acquiring follow different commercial structures. If both appear in one view, split them before using the data for market comparison.
Stale or non-reproducible sources#
Treat freshness and method as gate checks, not footnotes. A source dated September 2011 and tied to payments in Europe in 2010 can still help explain mechanics, but it is not a current launch benchmark. That ECB paper also says it should not be reported as an official ECB view. If publication date, scope, covered entities, or methodology fields are missing, quarantine the dataset.
Assemble the evidence pack before market sign-off#
Do not sign off a market until an independent reviewer can trace every assumption, test downside cases, and identify a clear owner for each open issue.
The minimum pack for this work has three parts: a benchmark source table, an assumptions log, and sensitivity scenarios by card network and pricing model. If any one is missing, sign-off is still provisional.
| Evidence item | What it must include | Verification checkpoint |
|---|---|---|
| Benchmark source table | Source name, publication date, geography, covered entities, pricing model, and whether figures include interchange fee, assessment fee, and markup | Confirm no blended categories and no mixing of merchant processing fees with distribution-platform fees |
| Assumptions log | Every conversion from source inputs into your model, including payment channel, card mix, and pricing approach (for example flat-rate or IC+ pricing) | Confirm each assumption maps to a named source, not team memory or "market standard" |
| Sensitivity scenarios | Upside and downside cases by card network and pricing model, plus known adders that can shift unit economics | Confirm downside cases still hold when mix shifts, not only in the base case |
The assumptions log is where weak decisions usually hide. If you anchor to a public price page, carry line items exactly as published, not one headline rate. For example, Stripe lists 2.9% + 30¢ for domestic cards. It also lists 0.5% for manually entered cards, 1.5% for international cards, and 1% for currency conversion. It separately lists IC+ pricing under custom pricing. Ignoring those adders turns a benchmark into a partial quote.
Include control proof in the same sign-off pack. Keep it practical: map control ownership and evidence status for Authorization, Authenticity, and Accountability, and flag unresolved compliance unknowns explicitly.
If Form 1099-K is in scope, document the reconciliation logic before approval. The referenced source describes Form 1099-K as issued by payment processors and marketplaces and as reporting gross income before fees. Finance should show how gross processed volume reconciles to net settlements and fee deductions.
Operational proof should confirm execution readiness, not just model quality. Require a reconciliation design, payout exception paths, and named accountability for unresolved unknowns, including who investigates, who approves fixes, and where those procedures are documented.
Use a clear sign-off gate:
- No unresolved high-impact unknowns
- No blended benchmark categories
- Documented rollback triggers with owner, condition, and response
If actual card mix, manual-entry volume, international share, or reconciliation breakage lands outside assumptions, the pause trigger and rollback owner should already be documented. If that is not defined before launch, the market is not ready for sign-off. For broader benchmark context, see State of Subscriptions 2026 Benchmarks for Platform Operators.
Before sign-off, run your assumptions through the payment fee comparison tool so card-mix and pricing-model scenarios are documented side by side.
Run a 90-day validation sequence before full rollout#
Treat a 90-day window as an internal go or no-go gate, not a universal standard. Expand only if observed fee outcomes stay close to your benchmark assumptions and your operating controls hold up in live flow.
Fee behavior can shift even when headline rates look stable. The evidence describes card payments as a two-sided market where consumers respond to rewards and merchants pay acceptance fees. It also flags fee pass-through into retail prices as a real risk. So this sequence should test real transaction behavior and control performance, not quoted pricing alone.
Phase 1 baseline measurement#
Start with a clean baseline for your current acceptance mix across Visa, Mastercard, and American Express. Track fee attribution and exceptions in a way finance and operations can reconcile from transaction activity through settlement and payout, with unclassified items called out early.
If you cannot consistently explain where costs and exceptions are coming from, stop here and fix the data and reconciliation before comparing models.
Phase 2 controlled pricing-model test#
Run a controlled test of alternative pricing approaches in one segment. Keep the scope narrow enough for tight review, and compare observed outcomes against the assumptions already documented in your benchmark and sensitivity work.
Treat unexplained variance as a stop condition for decision-making, not as a minor reporting issue.
Phase 3 compliance and payouts validation#
Validate compliance and payout controls under live conditions before expansion. Include the compliance checks and payout operations that apply to your program, and define pass/fail criteria before the pilot starts.
Use continuous monitoring, audits, policy checks, reporting, and GL reconciliation or audit-trail outputs as explicit pass or fail evidence during the pilot.
Final gate#
Proceed only when both are true:
- Observed results are consistent with benchmark assumptions within your pre-agreed internal variance.
- Operational controls are passing in reconciliation, monitoring, and payout or compliance workflows.
If either fails, do not scale yet. The point is to prove the model and controls with real transactions, not just to complete the 90-day window.
For a step-by-step walkthrough, see Platform Economy Payment Index for Contractor Payments.
Conclusion#
The practical takeaway is simple: keep benchmark categories separate, normalize assumptions up front, and make unknowns explicit before you commit to expansion. That discipline is more reliable than chasing one attractive headline number.
Do not collapse merchant acceptance costs, distribution charges, compliance effort, and payout rail constraints into one "all-in fee." Once those categories are blended, you lose sight of whether margin pressure comes from network economics, commercial terms, or operations.
Use a scope-and-normalization standard before drawing conclusions:
- Define what is in scope.
- Document your normalization approach.
- Mark missing fields clearly (transaction channel, pricing model, covered networks, plan tier, methodology limits).
- Treat incomplete benchmarks as directional, not decision-grade.
That caution is practical, not theoretical. Formal benchmarking work notes that new information can change earlier conclusions. Adjacent research also shows that even a benchmark-window change, from the past 15 trading days to three days, can materially shift observed fees, volume, and market share. Benchmark design choices change the answer.
Before sign-off, build an evidence pack that includes source structure, assumptions, live quote details, and unresolved unknowns by market. If your model depends on routing, card mix, or local network behavior, say so directly.
A useful reference model is the Federal Reserve Payments Study. It is explicit about benchmark artifacts, companion notes and tables, and release cadence, including a March 2026 release in the cited materials. It is not a direct marketplace fee benchmark, but it shows how to use benchmark inputs with context instead of lifting isolated numbers.
Price alone is not a reliable indicator of value. Include compliance, tax operations, and rail constraints in go-or-no-go decisions instead of anchoring only to the lowest visible fee.
If you want a market-specific read on payout and compliance constraints before launch, talk with Gruv.
Frequently Asked Questions
What is a realistic baseline range for platform payment fee benchmarks in merchant processing?
Use published percentage examples as a starting point, not as a universal baseline. Published examples vary by channel, such as Square Free plan examples of 2.6% + 15¢ card-present and 3.3% + 30¢ online. For decisions, compare effective rate (total processing fees divided by total sales volume), not headline pricing alone.
Why are fee benchmarks from different providers often not directly comparable?
Because the pricing model can differ even when the headline percentages look similar. A quote may be flat-rate or interchange-plus. You also need the plan tier, since published fees can change by plan.
Are merchant processing benchmarks and distribution platform take rates the same thing?
Distribution-platform fee data and merchant-processing benchmarks measure different things. Do not combine those benchmarks with merchant-processing figures unless you have like-for-like data for both.
What key details are usually missing from public benchmark articles?
The usual gaps are pricing model, plan tier, transaction channel, and the extra line items needed to calculate true all-in cost. A headline rate can rise once additional fees are included. Freshness checks matter too, because at least one cited benchmark source warns that some card information may be outdated.
How should founders compare markets when country-level fee data is incomplete?
Do not force a country ranking from incomplete data. First normalize what you do have: online vs. in-person mix, pricing model (flat-rate vs interchange-plus), and named plan tier. If those fields are missing, treat the estimate as provisional and wait for like-for-like quotes before making hard pricing or expansion commitments.
What should be verified first before committing expansion resources?
Start by verifying the real transaction path in live flow, including network fraud checks. Then confirm the commercial basics: pricing model, every fee line item needed for effective-rate math, and whether volume qualifies for custom-pricing discussions, for example $250,000 per year in the cited Square threshold. Also pressure-test low-ticket scenarios, where a fixed per-transaction component can become a large share of each transaction.
Try a related tool
Researched and edited by the Gruv editorial team. Gruv builds cross-border billing, payouts, and finance-operations software for global businesses.
Sources
- bcf.princeton.edu/wp-content/uploads/2023/01/Wang_jmp.pdftrusted
- eac.gov/sites/default/files/TestingCertification/Vol...trusted
- economics.princeton.edu/wp-content/uploads/2023/01/Wang_jmp.pdftrusted
- fdic.gov/analysis/cfr/bank-research-conference/annual...trusted
- federalreserve.gov/paymentsystems/fr-payments-study.htmtrusted
- irs.gov/individuals/international-taxpayers/foreign-...trusted
- irs.gov/individuals/international-taxpayers/figuring...trusted
- jolt.law.harvard.edu/assets/articlePDFs/v37/1-Van-Loo-Aggarwal-Am...trusted
Educational content only. Not legal, tax, or financial advice.
Related Posts

The Freelance Payment Penalty: A Modeled Audit of Platform Fees, FX Spreads, and Payout Delays
The money rarely disappears through a single, easy-to-spot fee. The real loss is stacked. A marketplace takes its commission, a processor adds a charge for international cards, a bank or payment company converts the currency at a spread, a platform holds the funds before release, and a wire sheds a little to intermediaries on the way in. Each layer looks defensible on its own, but the worker feels the combined result as a smaller deposit and a later payday.

How to Respond to a Subpoena for Business Records
Move fast, but do not produce records on instinct. If you need to **respond to a subpoena for business records**, your immediate job is to control deadlines, preserve records, and make any later production defensible.

A US Expat's Guide to Investing in UCITS ETFs to Avoid PFIC Issues
The real problem is a two-system conflict. U.S. tax treatment can punish the wrong fund choice, while local product-access constraints can block the funds you want to buy in the first place. For **us expat ucits etfs**, the practical question is not "Which product is best?" It is "What can I access, report, and keep doing every year without guessing?" Use this four-part filter before any trade: