
Quick Answer
Start with a payout failure benchmark report that fixes the denominator, close rule, and failure families before you compare any rate. Split results by rail, country, and failure family; keep returned-after-sent items and pre-release holds separate from failed initiation; and publish an evidence pack with metric extracts, status events, reconciliation output, and open exceptions.
Turn payout failures into a benchmark finance can use#
A useful payout failure benchmark report is not a prettier exception export. It is the operating document that tells your platform team which payout failures are real rail problems, which ones are recipient-data problems, which ones were held before release, and which ones were later recovered.
If you publish one blended failure number, you hide the very differences that determine the next move. A timeout on a bank push, a returned payout caused by bad beneficiary details, an unclaimed wallet payout, and a duplicate-risk investigation should not share the same owner or recovery playbook.
Public sources can help you define the environment, not your target rate. The Federal Reserve Payments Study is useful for rail-volume context, and Nacha's ACH Network Risk and Enforcement Topics is useful for thinking about returns and network quality. Neither source gives you a universal good payout failure rate for your platform.
The safest pattern is simple: lock the denominator, split outcomes by rail and country, and require every benchmark row to map back to request logs, provider status changes, and reconciliation output. This pairs well with our Platform Payments Quarterly Benchmark Report.
What a payout failure benchmark report actually measures#
A payout failure benchmark report should answer five questions for the same reporting period: how many payout attempts you initiated, how many failed before reaching the recipient, how many were returned after release, how many were recovered, and how much manual work the failures created.
Keep payout operations outcomes separate from payee-impact outcomes. For platform teams, business impact is usually measured with delayed payout days, support contacts, manual touches, or unresolved exception aging, not subscription-churn language lifted from card-billing content.
Write the metric dictionary before you compare anything#
Start with one metric dictionary and keep it boring. If finance, ops, and engineering cannot rebuild the same row from the same fields, the benchmark is still a narrative, not a control.
| Metric | Formula or decision rule | Include | Exclude | Why it matters |
|---|---|---|---|---|
| Attempt volume | Count payout instructions created in the reporting period | Bank, wallet, card, and local-transfer payouts after validation | Sandbox rows and draft records never submitted | Creates a stable denominator |
| Failed Payment Rate | Failed-before-credit payouts divided by attempt volume | Rejects, failures, and terminal provider errors before successful credit | Pre-release holds and late returns tracked elsewhere | Shows execution failure at initiation stage |
| Returned-after-sent rate | Returned or reversed payouts divided by posted or paid payouts | Bank returns, reversed credits, and expired or unclaimed payouts where funds came back | Failures that never left your system | Keeps post-send risk visible |
| Payment Recovery Rate | Recovered payouts divided by failed or returned payouts selected for recovery | Corrected recipient data, rerouted retries, and successful resubmissions | Cases closed as unsupported or intentionally stopped | Shows the fixable share |
| Manual touch rate | Cases with human intervention divided by failed or returned payout cases | Support work, ops review, engineering replay, and finance adjustments | Fully automated retries with no human work | Prices the ops burden |
If you already run a broader executive dashboard, keep these payout rows adjacent to reconciliation and balances rather than burying them inside one overall success widget. Our payment operations dashboard metrics guide is a good companion.
Build a comparable data model before you benchmark anyone#
Before you compare yourself with any provider or industry source, make your internal row model comparable first. The benchmark row needs enough fields to survive handoff between product, ops, engineering, and finance without anyone inventing meaning on the fly.
Capture the lifecycle, not just the first status#
Provider documentation is a good reminder that payout lifecycles are multi-step. Stripe payout reconciliation ties payout IDs to underlying balance transactions, Stripe's payout management guide distinguishes posted from returned payouts, and Adyen's marketplace payout webhooks show that a payout can move through several states before the outcome is final.
That means your report should not freeze on the first positive acknowledgment. Treat the first API acceptance as an event, not the final truth, unless the rail and provider guarantee that the state cannot change later.
Add a known-versus-unknown block for outside sources#
For every outside source, write down what the source definitely tells you and what it does not. This stops public benchmark material from turning into accidental operating targets.
| External source | Reliable signal | What it does not prove | Best use in your report |
|---|---|---|---|
| Federal Reserve Payments Study | Aggregate noncash payment trends by method | Your platform's payout failure baseline or payee mix | Context on rail scale and why cohorts differ |
| Nacha risk topics | Return and quality language plus ACH governance pressure | A target failure rate for your credit-payout program | Reason-code and network-risk context for ACH corridors |
| Stripe payout docs | Payout status changes, returned-payout handling, and payout-to-transaction reconciliation | How another provider compares to your portfolio mix | Field design and reconciliation rules |
| Adyen payout webhooks | Multi-stage transfer states and event sequencing | Direct comparability across providers or rails | State model for asynchronous payouts |
| PayPal reports and unclaimed payout docs | Transaction logs and unclaimed-to-return behavior | Bank-payout behavior outside PayPal's ecosystem | Separate unclaimed or expired items from hard failures |
| J.P. Morgan Global Payments docs | Explicit status responses, callbacks, and beneficiary-data risk context | A universal cross-border benchmark | Status tracking and data-quality control design |
If a row cannot state its denominator, geography, and event scope in one sentence, tag it directional and keep it out of the decision-grade table.
Segment by rail, country, and failure family so risk is visible#
Start the cut at rail x country_or_region, then split again by your own failure family. That gives you a stable view of where the rail is behaving differently, where local beneficiary formats are hurting you, and where your recovery playbook actually works.
This is also why provider status material matters. J.P. Morgan's Global Payments error-code and status materials describe pending and rejected states, while PayPal's transaction logs show step-level payout transaction codes. Your internal report should be just as explicit.
Build the cut for decisions, not just charts#
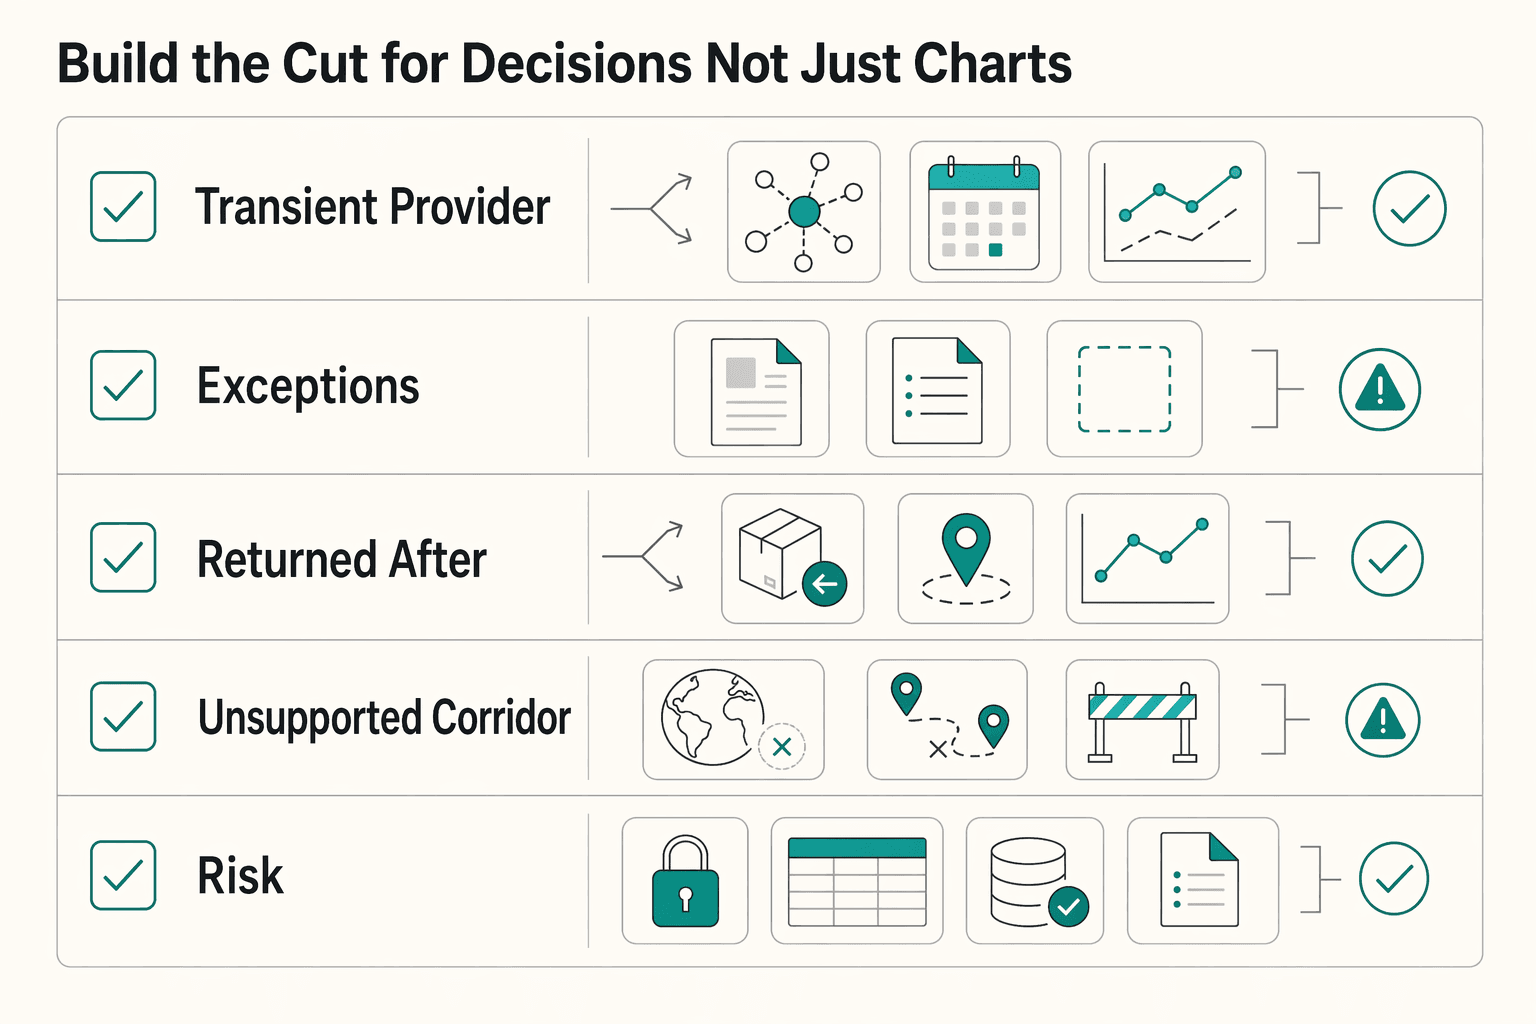
| Failure family | What it usually signals | Core benchmark question | Primary owner | First next move |
|---|---|---|---|---|
| Transient provider or network error | Timing, availability, or route issue | Does retry or reroute recover enough volume to matter? | Payments ops and engineering | Test retry timing and route fallback on one cohort |
| Recipient-data mismatch | Account details, name match, account closed, or unsupported format | Are failures concentrated in onboarding or detail capture? | Product and ops | Tighten bank-detail capture and correction loops |
| Returned after sent | Payout left your system but funds came back later | Are you closing too early or using the wrong final-state rule? | Ops and finance | Add a separate returned-after-sent KPI and late-return aging |
| Unsupported corridor or program configuration | Route not enabled or not offered | Should this sit outside the core failure denominator? | Product | Mark out of scope and update pre-flight routing checks |
| Duplicate-risk or operator resubmission | Ambiguous responses or manual replay | Are recoveries inflating volume while duplicate exposure grows? | Engineering and ops | Tie retries to idempotency and case review |
Keep lifecycle-specific paths separate#
Different payout products need different close rules. A direct bank payout, a batch payout, and a wallet payout can all move through different status shapes before you know the final outcome.
| Payout path | Example lifecycle | Benchmark rule | Common mistake |
|---|---|---|---|
| Direct API payout | created to processing to posted or failed or returned | Use final posted or returned state at period close | Treating first acceptance as success |
| Batch payout | batch received to item-level success, failure, or return | Benchmark at item level, not file level | Counting batch acknowledgment as 100 percent success |
| Wallet or claim-based payout | sent to unclaimed to returned or claimed | Track unclaimed separately and measure auto-return timing | Merging unclaimed items into immediate failure |
| Cross-border bank payout | submitted to pending to credited or returned | Keep pending aging and beneficiary-data corrections visible | Hiding long-tail returns inside generic pending |
PayPal's unclaimed payout guidance is a good reminder that not claimed yet and failed are not the same state.
Separate pre-release holds from true payout failures#
If the payout never left your control plane, it should not sit inside the same numerator as a rail failure. Pre-release holds matter operationally, but they answer a different question: why was money not allowed onto the rail in the first place?
Use a release-state table#
| Release state | Count in Failed Payment Rate? | Track as separate metric | Owner | Why it matters |
|---|---|---|---|---|
| Recipient details incomplete | No | Pre-release hold rate | Product and ops | Stops avoidable bad instructions from entering the rail |
| Risk or policy review hold | No | Review aging and release rate | Risk and ops | Protects the rail metric from holdback noise |
| Insufficient payout balance or reserve constraint | No | Funding or liquidity exception rate | Finance and ops | Shows cash and reserve friction rather than rail failure |
| Unsupported corridor or currency setup | No | Unsupported request rate | Product | Points to routing and product-configuration gaps |
Keeping these states separate makes your rail benchmark honest. It also prevents teams from improving the failure rate simply by holding more payouts before release.
Keep recipient-data failures visible#
Recipient-data problems deserve their own line of sight because they are often recoverable with better capture and validation. In Stripe's payout management docs, incorrect destination information is called out as a common cause of returned payouts. J.P. Morgan's cross-border payment modernization guidance likewise argues that pre-validating beneficiary bank information can reduce the risk of failed payments and fraud.
That is the signal to carry into your benchmark. If one corridor fails because beneficiaries enter bad bank data, fix capture, verification, and correction loops before you spend the quarter tuning retry timing. For deeper investigation patterns, read Payout Failure Root Cause Analysis for Bank, User, and Processor Errors at Scale.
Instrument the payout stack so the numbers are audit-ready#
A payout failure benchmark report becomes decision-grade only when every row can be traced from payout request to provider status change to reconciliation. If the row depends on screenshots, tribal knowledge, or ad hoc SQL, it belongs in an exception view, not in the main benchmark.
Use provider artifacts that make reconciliation concrete. Stripe payout reconciliation is designed to map payout IDs to constituent transactions, and PayPal reports and transaction logs show how step-level transaction codes can support troubleshooting and balance review.
Make every outcome traceable#
For each payout case, store the internal request reference, beneficiary reference, provider payout or transfer ID, latest lifecycle state, timestamps for each state change, reconciliation reference, and final close rule used in the report. If you cannot populate those fields, mark the row low trust.
Protect recovery from creating duplicates#
Recovery work should improve payout completion, not create double-send risk. Keep retries idempotent, separate automated retries from manual resubmissions, and audit any cohort where recovered payouts rise faster than duplicate investigations close.
Provider callback models reinforce this. J.P. Morgan's Global Payments callbacks and status-response docs assume the payment keeps moving after initiation, so your recovery report should do the same.
Publish one evidence pack per reporting period#
| Artifact | Minimum contents | Owner | Why it belongs in the report |
|---|---|---|---|
| Metric extract | Denominators, numerators, filters, and period-close rule | Finance or data | Proves how the KPI was built |
| Status event export | State changes, error codes, and provider references | Engineering or ops | Shows where the payout actually failed or returned |
| Reconciliation output | Payout ID to ledger or balance mapping | Finance | Prevents unreconciled rows from being treated as facts |
| Exception queue | Low-trust rows, manual investigations, and aging | Ops | Keeps uncertainty visible |
| Change log | Taxonomy, routing, or rule changes in the period | Product | Explains step-changes before leadership overreacts |
This evidence pack is what lets you carry one month of benchmarking into the next without rewriting history. If you want adjacent metrics for leadership review, pair it with 20 Payment Operations Dashboard Metrics for Marketplace CFOs.
Use external benchmarks without overclaiming#
External benchmarks are useful only when you keep them in the right lane. Public and provider sources can tell you how a rail behaves, which lifecycle states exist, or how reporting artifacts are structured. They usually cannot tell you whether your platform should accept a 0.4 percent or 1.1 percent payout failure rate.
What public sources can tell you#
- how large or common a payment method is in a market
- what return or risk language a network uses
- which states a provider exposes before the outcome is final
- where beneficiary-data quality or unclaimed states create separate failure patterns
What should stay internal#
- your acceptable failure and recovery bands
- your payee-impact thresholds
- your manual-touch and exception-aging tolerances
- your decision rule for retry, reroute, or stop
The safest habit is to write a confidence label beside every outside row: benchmark context, workflow reference, or not comparable enough to score.
Turn benchmark findings into roadmap decisions#
Use the report to choose the next 90 days of work, not to build a museum of exceptions. Rank fixes by recoverable volume, payee impact, engineering effort, and dependence on external parties.
If the problem clusters before release, improve routing checks, bank-detail capture, and beneficiary validation. If the problem clusters after submission, work on provider fallback, retry windows, reconciliation lag, and clear ownership for returned payouts.
Keep the test small enough to prove or kill. One meaningful cohort is better than six half-owned initiatives.
- Days 1-30: lock metric definitions and select one segment with meaningful volume
- Days 31-60: ship one targeted fix and review reconciliation, exceptions, and event traces weekly
- Days 61-90: compare pre/post results, document tradeoffs, and decide on expansion
Concrete next step: align your metric dictionary for Failed Payment Rate, returned-after-sent rate, Payment Recovery Rate, and manual touch rate, then run one pilot on your highest-volume rail-country segment. Follow-on reading: Time to First Payout Benchmark by Vertical for Platform Teams and Payout Failure Root Cause Analysis for Bank, User, and Processor Errors at Scale.
Conclusion#
A useful payout failure benchmark report should end debates about what happened and shift the conversation to what to fix next. If the report cannot show the denominator, the final payout state, the recovery owner, and the reconciliation trail, it is still diagnostic material, not a benchmark.
The most reliable teams do four things in order: lock the metric dictionary, segment by rail x country x failure family, keep pre-release holds out of the core failure numerator, and publish an evidence pack every period. Once you do that, your benchmark stops being a blended error report and starts acting like a control system.
Public sources can still help, but only as context. The Federal Reserve Payments Study can tell you how payment methods shift over time, Nacha's ACH risk topics can clarify return and network-risk language, and provider docs can show how payout states progress. Your own logs are still what define acceptable failure rates and worthwhile recovery work.
If you want one practical next move, pilot the benchmark on your highest-volume rail-country cohort, keep the evidence pack small and auditable, and promote only the fixes that change a real recoverable failure family. When you are ready to operationalize it, talk to Gruv.
Frequently Asked Questions
What is a payout failure benchmark report?
A payout failure benchmark report is a structured view of how often payment attempts fail and how many of those failures are later recovered. At minimum, it should keep the core formula stable: Failed Payment Rate = failed attempts ÷ total attempts × 100, then pair that with recovery tracking and a clear scope note on what counts as a failure.
What is a good failed payment or payout rate for a platform?
There is no universal good rate. Compare only cohorts with the same rail, geography, beneficiary type, and period-close rule, then ask whether your internal baseline and recovery rate are improving.
Which metrics matter most to ops, finance, and engineering?
Start with Failed Payment Rate, returned-after-sent rate, Payment Recovery Rate, manual touch rate, unresolved exception aging, and the share of rows that can be fully reconciled.
What should be segmented by country versus by rail?
Segment by rail first because settlement speed, return behavior, and provider state models differ by rail. Then split by country or corridor where beneficiary formats, currency behavior, and local banking practices materially change failure patterns.
How should we treat returned payouts versus failed initiation?
Keep them separate. A returned payout already left your system and came back later, which makes its operational cost, reconciliation path, and payee impact different from a payout that failed before release or before final credit.
How often should benchmark reporting be updated?
Pick one cadence and keep it stable enough that teams are comparing like with like every cycle. If you are in a pilot or fixing an active problem, review more frequently. If not, consistency matters more than speed. The red flag is changing cadence, scope, or denominator at the same time, because that makes improvement claims hard to trust.
How do we compare external benchmarks when methodologies are unclear or gated?
Treat them as context only until you can state the denominator, geography, payment types, time period, and inclusion rules. If you cannot write those fields down, do not use the external number as a target.
Try a related tool
Researched and edited by the Gruv editorial team. Gruv builds cross-border billing, payouts, and finance-operations software for global businesses.
Sources
Includes 5 external sources outside the trusted-domain allowlist.
- docs.stripe.com/payouts/reconciliationtrusted
- docs.stripe.com/global-payouts/manage-payoutstrusted
- federalreserve.gov/paymentsystems/fr-payments-study.htmtrusted
- developer.payments.jpmorgan.com/api/treasury/global-payments/global-payments...external
- developer.payments.jpmorgan.com/docs/treasury/global-payments/capabilities/g...external
- docs.adyen.com/marketplaces/payout-to-users/payout-webhooksexternal
- docs.paypal.ai/growth/payouts/manage-payouts/reports-transa...external
- docs.paypal.ai/growth/payouts/manage-payouts/handle-unclaim...external
Educational content only. Not legal, tax, or financial advice.
Related Posts

Platform Payments Quarterly Benchmark Report
Use this report as an expansion decision filter, not a KPI scoreboard. Its job is to help platform founders and Payments Ops teams rank where to expand next by weighing upside and execution load before product or go-to-market work starts.

20 Payment Operations Dashboard Metrics for Marketplace CFOs
A useful payments dashboard is a decision tool, not a wall of charts. For a marketplace CFO, **payment operations dashboard metrics** should answer four questions fast: what changed, who owns it, what gets checked next, and what action starts now instead of waiting for month end.

Payout Failure Root Cause Analysis for Bank, User, and Processor Errors at Scale
Payout failure root cause analysis works best when you separate likely causes early instead of treating every failure as the same kind of incident. Issues at different points in the payout flow can all surface as "payout failed," but they may not have the same owner or the same fix.