
Quick Answer
Choose the best log management tools by matching your operating model first: managed for speed and low upkeep, self-hosted only if you will own ongoing telemetry work. Use the Foundation, Shield, and Engine sequence to avoid overbuilding early. Start with centralized logs and clear alerts, then build incident evidence and retention discipline, and only then expand into growth analysis. If your setup cannot take you from alert to verified fix quickly, it is the wrong fit.
Why Most Log Management Advice Fails the 'Business-of-One'#
If you run a SaaS alone, most advice on the best log management tools starts from the wrong assumption: that you have spare ops capacity. Usually, you do not. The real question is not, "Which platform wins the longest feature checklist?" It is, "Which option gives you reliable visibility without quietly taking over your week?"
- The Admin Tax
Most roundups treat setup like a one-time annoyance instead of an ongoing bill on your attention. For a solo operator, that is backward. Score every option on three things: setup effort, ongoing maintenance load, and opportunity cost. If a tool needs custom collectors, constant tuning, or transport babysitting, write down your own verified estimate for initial setup and monthly care before you call it affordable.
A practical checkpoint matters more than marketing here. Can your logs land in one centralized place through an API or by configuring each source to send directly to the manager? If that path is fuzzy, you are already paying the tax. Another red flag is vague thinking around transport failures. Packet loss is a real collection risk, so if the product story skips delivery reliability, buffering, or what happens when ingestion breaks, assume you will be the one debugging the gap.
- The Enterprise Frame Problem
Some 2026 comparison content is written for buyers much closer to the Fortune 500 than to a business-of-one. That does not make the advice wrong. It means the weighting is off for your reality. Features built for large-team coordination can move down your list, while day-to-day reliability capabilities should move up.
For many solo operators, organizational overhead ranks lower: layers of user administration, complex approval paths, and heavy team-routing features. The must-have bucket is simpler: centralized logging across multiple sources, real-time error visibility, threshold-based alerting, and a retention period that matches your data volume. If a tool is excellent at managing people but clumsy at surfacing one production failure fast, it is solving someone else's problem.
- The Feature-to-Outcome Gap
Logs matter only if they help you act. A polished demo is not the point. The point is resolving incidents faster and understanding what failed before small issues turn into repeated user complaints. Error reporting and crash monitoring tools help because they automatically capture, categorize, and alert on failures in real time. Without that visibility, problems often stay hidden until users complain.
Pricing discipline matters too. These tools use very different pricing structures, so budget fit is not a side note. Check whether you can pull a clear incident trail from logs and alerts quickly, without extra operational overhead. If you cannot, the tool may still be powerful, but it is not helping with your actual job.
That change in criteria shapes the rest of this guide. Instead of judging tools by enterprise breadth, use a three-stage model: what protects your operations first, what adds durable coverage second, and what earns its complexity later.
Stage 1: The Foundation - Bulletproof Your Operations in Under an Hour#
For this stage, pick the tool that gets you from incident to answer with the least operational overhead, not the biggest feature list. If a platform requires you to run databases, tune indexing, or manage shippers before logs become useful, skip it for now.
| Triage step | What to confirm |
|---|---|
| Alert | Get an alert |
| Isolate | Narrow the issue to the service or release |
| Identify cause | Find the error trail |
| Confirm fix | Confirm in fresh logs that the fix worked |
- Apply a zero-admin selection checklist first
Use this quick filter before you compare anything else:
- Managed SaaS delivery
- Native log-drain support for the host/runtime you already use
- Clear alerting
- Searchable logs you can use on day one without complex query work
If your setup path looks like Graylog + Elasticsearch/OpenSearch + MongoDB, that is already high friction for a solo foundation stage. A production-ready open-source setup can consume 40 hours; at $120/hour, that is $4,800 of attention before you resolve your first customer issue.
- Evaluate by triage flow, not feature count
Run a practical four-step test on every tool: alert -> isolate -> identify cause -> confirm fix. When something breaks, can you quickly:
- Get an alert
- Narrow the issue to the service or release
- Find the error trail
- Confirm in fresh logs that the fix worked
If you need heavy query-language ramp-up before you can do that reliably, it is probably not your Stage 1 fit.
- Start with a tiny, business-critical event set
Do not build a full taxonomy yet. Seed four starter event names:
acquisition.signup_completedbilling.payment_succeededauth.login_failedworkflow.import_completed
Then test like an operator: send one event per type and verify the timestamp and source. Watch for false silence, where your app is fine but ingestion is broken.
| Option | Setup friction | Signal clarity | Day-one confidence |
|---|---|---|---|
| Managed SaaS logging-first | Low | High | Strong fit when you want fast alerts and searchable logs with minimal admin |
| Managed SaaS broader observability entry plan | Medium | Medium to high | Good fit if you expect to add metrics/APM soon |
| Self-hosted open source | High | Low at first | Only a fit if you already run this stack and accept the admin tax |
Stage 2: The Shield - Turn Your Logs from a Liability into an Asset#
Treat your logs as business evidence once Stage 1 is stable. That is how you answer SLA questions, billing disputes, and incident timeline reviews with a clear record instead of guesswork.
| Evidence item | What to keep |
|---|---|
| Incident record | Timestamps and status history |
| Access and change logs | Relevant access and change logs |
| Alert and query evidence | Alert snapshots, exported query results, and attached evidence files |
| Communication notes | Communication notes for client, legal, or regulator follow-up |
- Build one incident record first
Use one system as your single source of truth. When an event starts, open a unique record and keep the status, owner, deadline, and attached evidence files there so you do not have to reconstruct events from scattered email or chat later. Your checkpoint: for one real or test incident, confirm you can follow the timeline from first alert to response, change, and resolution in one place.
- Define your audit trail in four parts
Keep this simple and explicit: data access logging, change history, retention policy, and access controls. If you handle personal, payment, health, or financial reporting data, map those four parts to your framework and keep exact legal requirements tied to a verified source.
| Framework | Retain | Keep quickly retrievable | Archive candidate |
|---|---|---|---|
| GDPR | Personal-data access records, admin changes, and incident records involving personal data. Exact retention rule still needs framework or counsel confirmation. | Recent access and change history needed for active investigations or user requests. | Older records preserved under your retention policy and restorable when needed. |
| PCI DSS | Payment-environment access, authentication events, and privileged changes. Exact retention rule still needs framework or counsel confirmation. | Current-period security and access records tied to payment operations. | Older operational logs not needed for daily triage but still required by policy. |
| HIPAA | Access records, admin actions, and incident history involving protected health information. Exact retention rule still needs framework or counsel confirmation. | Recent records needed for investigations, reviews, or client response. | Older records that must be preserved but do not need day-to-day search. |
| SOX | Financial-system changes, privileged access, and records tied to reporting integrity. Exact retention rule still needs framework or counsel confirmation. | Current reporting-cycle evidence and recent change history. | Prior-period records kept for audit support and later retrieval. |
- Use tiered storage based on actual use
Put active investigative logs in hot storage, lower-touch operational history in warm storage, and long-tail evidence in archive. Move data by retrieval need, not just age. In practice, billing events, auth failures, and customer-facing incident records usually stay searchable longer than verbose debug logs.
- Preserve a minimum incident evidence package
When a security incident happens, keep the smallest complete package that preserves the chain of events without over-claiming certainty. At minimum, keep:
- the incident record with timestamps and status history
- relevant access and change logs
- alert snapshots, exported query results, and attached evidence files
- communication notes for client, legal, or regulator follow-up
Run one restore test from archive and verify that key timeline details and identifiers are still intact after export. If that fails, your retention policy may look good on paper but break when you need it.
Stage 3: The Engine - Make Your Log Data Grow Your Business#
At this stage, your logs should help you make faster business decisions, not just explain incidents after the fact. Your goal is simple: shorten the path from signal to action, then prove the result.
Start in this order: define the business objective, catalog log sources, then choose tooling. If you skip objective and source mapping, you can end up with dashboards that look detailed but cannot answer practical questions about releases, tenants, or conversion impact.
Run a decision loop every week#
Use this six-stage flow as your operating checklist: identification, collection, parsing, enrichment, storage, and practical analysis.
- Define service-level signals
Pick signals tied to promises you actually make: API latency, background job delay, auth failure rate, checkout errors, import completion time. For each signal, leave the threshold pending until it is tied to a measured baseline or customer promise, then assign an owner and attach a saved query plus a service/route label.
- Set early-warning alerts
Alert before customers feel the issue. Split alerts into page now and review later so signal quality stays high. Avoid raw error-count alerts without traffic context.
- Investigate root cause quickly
Keep logs centralized so you are not hunting across systems for one error. Enrich events with request ID, trace ID, release version, and tenant/account ID so one alert can map to the affected deploy, dependency, and customer path.
- Close the loop with a documented fix
Record the symptom, root cause, change made, affected service, and before/after metric snapshot. Link the commit, ticket, or change note so each incident becomes reusable operating knowledge.
Keep costs controlled as you scale this loop. Structured logging plus edge filtering can reduce ingestion cost by 30-50% in some environments. Lower-value telemetry can be routed to cheaper storage tiers instead of always staying in hot search.
Turn logs into business intelligence#
Use one compact review each week:
| Analysis area | What you review | Operating note |
|---|---|---|
| Feature adoption | Repeated endpoint/job/event usage by account, plan, or tenant | Set the threshold from observed usage baselines, not a generic benchmark. |
| Failure hotspots | Retry clusters, 4xx/5xx patterns, timeout concentration by route/dependency/release | Set the threshold from incident history and customer-impact tolerance. |
| Customer journey friction | Drop-off or delay points in signup, onboarding, import, checkout, and invite flows | Set the threshold from measured drop-off baselines and support commitments. |
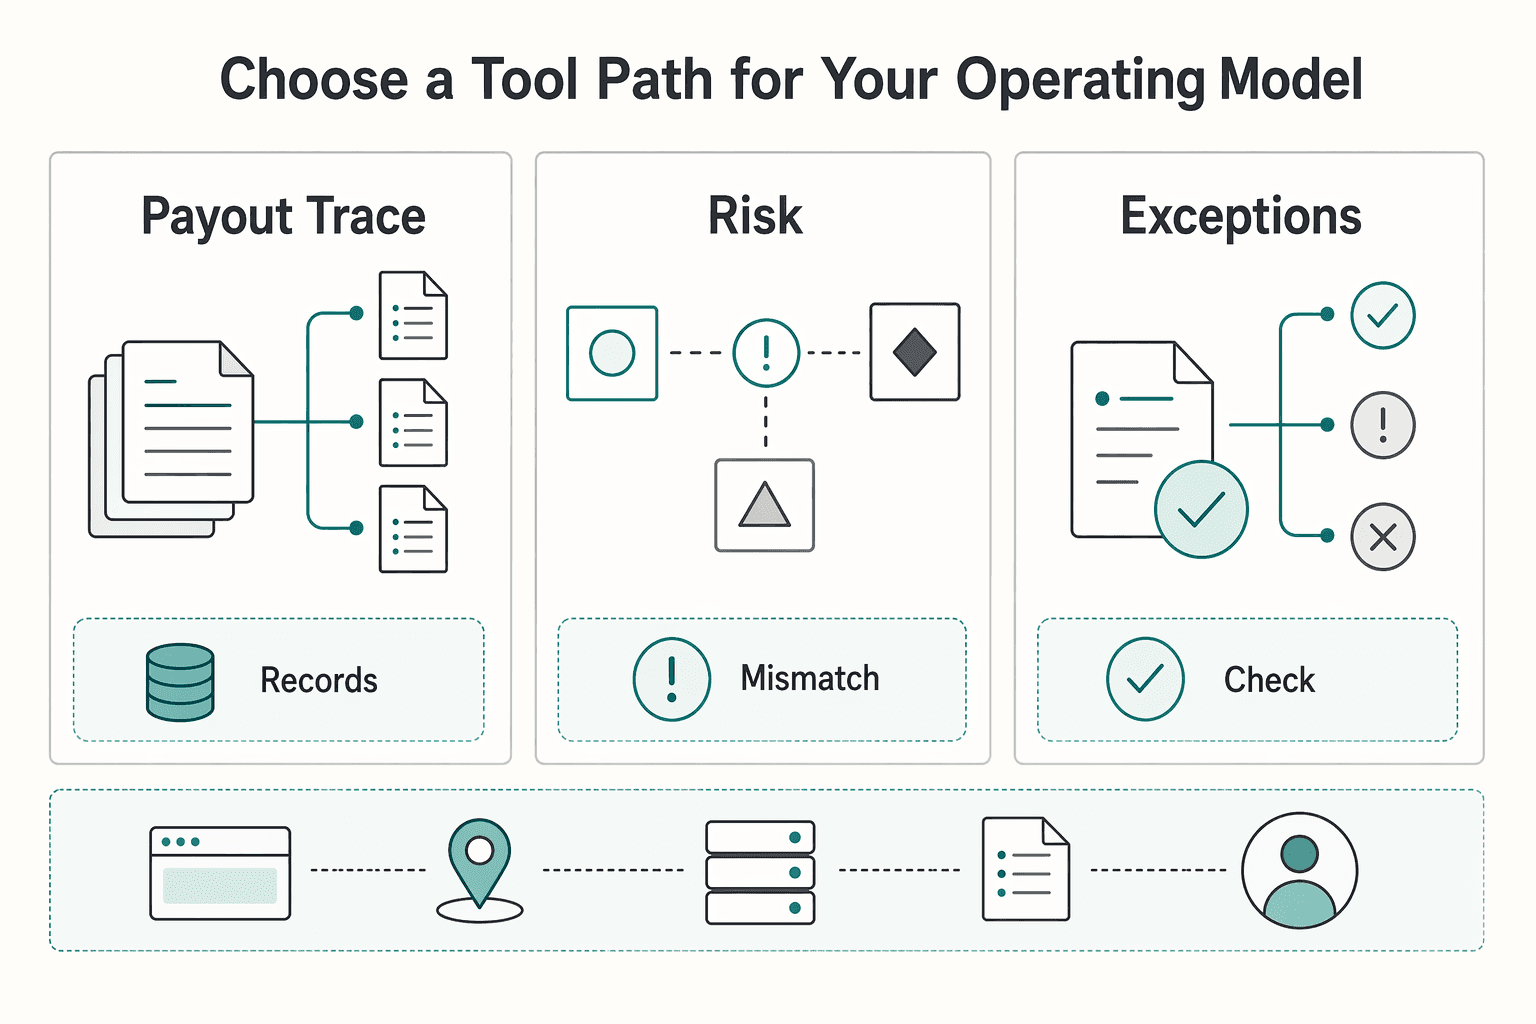
Choose a tool path for your operating model#
| Tool path | Example | Strengths | Tradeoffs | Best fit |
|---|---|---|---|---|
| Unified observability path | Datadog | Can reduce handoff overhead when logs and traces are correlated in one place | You must verify query speed, setup effort, pricing clarity, and scale fit in your own trial | You want fewer tools and faster cross-signal investigation |
| Aggregation-first path | Grafana Loki stack | High control over pipeline stages (collection, parsing, enrichment, storage, analysis) | More pipeline ownership, with higher risk of fragmentation if maintenance slips | You are comfortable owning telemetry plumbing |
| Error-first path | Sentry-centric workflow | Keeps user-visible failures and release issues front and center | You need deliberate correlation to connect errors to broader service and business outcomes | Your most urgent pain starts with exceptions and regressions |
No matter which path you choose, hold it to the same checks: query speed, ease of setup, pricing transparency, and scalability. Your real checkpoint is one clear narrative from front-end signal to trace to log event to customer outcome. Related: The Best Tools for Monitoring Application Performance (APM).
Conclusion: Build Your Command Center, Not Just a Log Viewer#
Make the final choice with a business rule, not a feature wish list. Your log setup should follow three things you can actually control: business risk, client expectations, and the maintenance time you can spare each week.
| Stage | Primary focus | Checkpoint |
|---|---|---|
| Foundation | Get to a usable signal fast | Coverage for 3 monitoring areas: system health, network-side issues, and component health; watch CPU, memory around the 80% mark, and storage growth |
| Shield | Treat logs as evidence you may need to explain later | Check for transport problems such as dropped UDP packets |
| Engine | Use logs for planning only after collection and search are trustworthy | Watch for high CPU slowing processing and the web interface, and disk filling quickly as logs are collected, parsed, and enriched, sometimes in two different spots |
- Foundation
Start with the operating model that gets you to a usable signal fast. If you choose a managed path, the win is usually less upkeep. If you choose self-hosted, your checkpoint is simple but real: you need coverage for 3 monitoring areas, system health, network-side issues, and component health. If you are not prepared to watch CPU, memory around the 80% mark, and storage growth, you are not just buying flexibility, you are buying ongoing responsibility.
- Shield
Treat logs as evidence you may need to explain later to a client, an auditor, or yourself after a bad week. Cleaner client communication comes from being able to show what happened and when, not from having the most dashboards. A red flag is weak delivery health. If you are not checking for transport problems such as dropped UDP packets, your record may look complete while important events never arrived.
- Engine
Use logs for planning only after collection and search are trustworthy. Better planning inputs come from patterns you can rely on, not noisy data and slow queries. A common failure mode is operational drag: high CPU can slow processing and the web interface, and disk can fill quickly as logs are collected, parsed, and enriched, sometimes in two different spots.
What to do next:
- Choose your operating model: managed for speed, self hosted only if you will maintain it.
- Define your evidence needs before you buy more features.
- Set a review cadence to recheck health, costs, and whether the tool still fits your real risk profile.
Frequently Asked Questions
What is the easiest log management tool to set up for a solo developer?
Start with a managed platform if your main goal is fast troubleshooting, not infrastructure ownership. A practical checkpoint is whether you can ingest logs, run a saved search, and set a basic alert quickly. If setup spills into parser tuning, storage planning, and host maintenance, you have probably chosen something too heavy for a one-person shop.
Is the ELK Stack or OpenSearch overkill for a personal project or small SaaS?
It can be, unless you already want to spend time on collection, security, patching, and query tuning. The tradeoff is clear: self-hosted gives you more control, but it also adds operational overhead and a steeper learning curve that can eat the same hours you need for product and support. If you cannot justify that maintenance burden in writing, pick managed first.
What are the right log management tools for Vercel, Netlify, or DigitalOcean?
Match the tool to the shape of your system. For any host, first verify the current log export path, then confirm your destination can ingest and parse reliably and that search/query workflows are fast enough for real troubleshooting. If your setup requires maintaining agents or multiple forwarding paths, count that maintenance burden up front.
How should I choose between a managed platform and a Loki-style self-hosted path?
If you need visibility in minutes, pick managed. If you want more control over storage and are comfortable owning the plumbing, a Loki-style route can fit. The useful comparison is maintenance burden, troubleshooting speed, and cost predictability. A common failure mode with self-hosted stacks is fragmented logs across components, which slows root-cause work right when you need speed.
For a small project, how should I think about Datadog versus a leaner alternative?
Datadog makes sense when you will actually use unified observability across logs, metrics, and traces. In one G2 comparison, Datadog was listed at starting ingest of $0.10 per ingested or scanned GB and $1.70 per million log events/month for standard indexing, while New Relic was listed with a free 100 GB limit and $0.40/GB beyond that. Recheck official pricing before you commit. If you mostly need searchable logs and one or two alerts, a leaner option may be easier to budget. If you routinely jump from alert to trace to log line, the integrated path can shorten investigation time.
How can I handle compliance logging on a small budget?
Decide three things first: where logs are stored, what must stay searchable, and what you need to prove later. Keep an evidence pack with your retention decision, access controls, redaction rules, and any requirement that still needs confirmation. If you cannot explain why a log field is kept, redact it or stop collecting it.
How long should I retain logs for legal or contractual reasons?
There is no single retention period you should copy from a blog post. Use your jurisdiction, contracts, and data categories to set a written rule, then leave the exact rule pending until counsel or the relevant authority confirms it. The operator detail that matters most is documentation hygiene: keep the policy, storage location, archive method, and deletion schedule together so you can show your reasoning later.
Can logs help you monitor SLAs or customer promises?
Yes, if you define the signals before you buy more tooling. Track a short list such as API latency, auth failures, background job delay, and checkout errors, but keep each threshold pending until it is tied to a measured baseline or customer promise. Your checkpoint is that every alert has an owner, a saved query, and a named service or route attached to it.
What is the biggest mistake people make after they pick a tool?
They assume collection alone equals coverage. It does not. Small blind spots can turn into larger outages, so verify ingestion and parsing, test search speed on a real incident query, and make sure alert noise is low enough that you will still trust it two weeks from now.
Try a related tool
Researched and edited by the Gruv editorial team. Gruv builds cross-border billing, payouts, and finance-operations software for global businesses.
Sources
Includes 6 external sources outside the trusted-domain allowlist.
- files.eric.ed.gov/fulltext/ED674474.pdftrusted
- rules.utah.gov/wp-content/uploads/uac17_03.pdftrusted
- betterstack.com/community/comparisons/log-monitoring-toolsexternal
- cribl.ioexternal
- crosstrax.co/incident-tracking-software-bestexternal
- devopsschool.com/blog/top-10-log-management-tools-features-pr...external
- graylog.org/resources/graylog-monitoringexternal
- gruv.ai/blog/the-best-log-management-tools-for-saas-...external
Educational content only. Not legal, tax, or financial advice.
Related Posts

Value-Based Pricing for Freelancers Under Real Payment Risk
Value-based pricing works when you and the client can name the business result before kickoff and agree on how progress will be judged. If that link is weak, use a tighter model first. This is not about defending one pricing philosophy over another. It is about avoiding surprises by keeping pricing, scope, delivery, and payment aligned from day one.

Best APM Tools for Small Teams That Need Reliable Incident Triage
If you are comparing the **best apm tools**, pause the generic rankings and ask a harder question: what can you operate cleanly with the time and attention you actually have? The right choice depends less on who won a roundup and more on your incident pattern, your operator bandwidth, the onboarding effort you can absorb, and how costs behave as telemetry grows.

The Freelance Payment Penalty: A Modeled Audit of Platform Fees, FX Spreads, and Payout Delays
The money rarely disappears through a single, easy-to-spot fee. The real loss is stacked. A marketplace takes its commission, a processor adds a charge for international cards, a bank or payment company converts the currency at a spread, a platform holds the funds before release, and a wire sheds a little to intermediaries on the way in. Each layer looks defensible on its own, but the worker feels the combined result as a smaller deposit and a later payday.