
Quick Answer
To run a profit and loss report in QuickBooks, open Reports, choose Profit and Loss Detail, set your date range, and run the report with a saved view for consistency. Then validate Income Accounts, Cost of Goods Sold, and Expense Accounts before acting. Use the output as a risk-control workflow to catch margin pressure, data issues, and cashflow friction early with weekly and monthly review cycles.
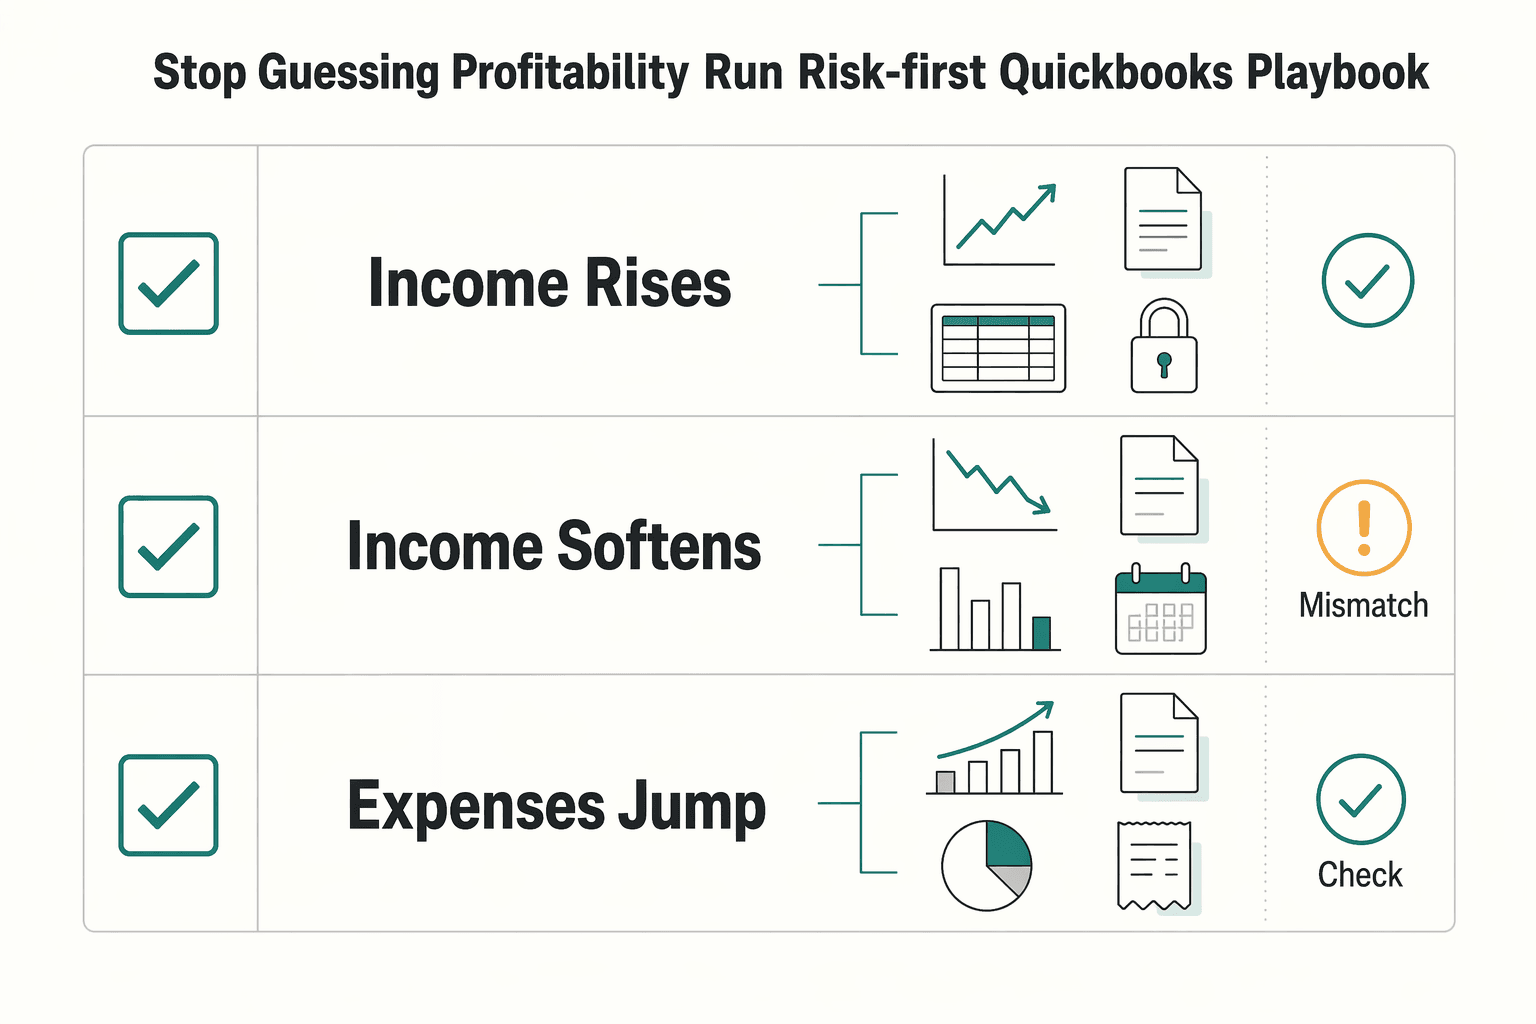
Stop guessing on profitability and run a risk-first QuickBooks playbook#
Use your QuickBooks profit and loss report as a risk control system, not a bookkeeping chore. If you invoice clients, this report helps you spot margin pressure and make earlier operating decisions.
In QuickBooks, the Profit and Loss (P&L) Statement is the same report as the Income Statement, so we will use both names to mean the same thing.
If you run a business of one, your P&L is the control panel that keeps delivery, pricing, and cash aligned.
It is easy to treat QuickBooks reports as pure history. This guide flips that. You will run one consistent report, read it for risk signals, check for data issues that can distort decisions, and build a weekly and monthly rhythm you can trust.
Step 1. Define what this report must decide. A profit and loss view totals income, subtracts expenses, and shows net profit or loss. Your job is to connect that output to a decision this cycle, not admire the spreadsheet.
Step 2. Choose the time window on purpose. QuickBooks lets you compare performance across week, month, and year. Use weekly checks for fast triage, monthly checks for operating control, and quarter or year views for planning direction.
Step 3. Read it as an operations dashboard. Treat line changes as business signals that should trigger action. If a line moves, ask what changed in your workflow and what you will update next.
| P&L signal | Risk question | Action |
|---|---|---|
| Income rises but net profit drops | Are costs rising faster than delivery value? | Tighten expense categories and adjust scope or pricing. |
| Income softens in the current period | Is timing or client mix increasing payment risk? | Prioritize collections and rebalance near-term work. |
| Expenses jump unexpectedly | Is this a one-off or a new cost pattern? | Cut noncritical spend and protect core delivery. |
For example, your month looks busy, but take-home profit slips. Instead of guessing, you run the playbook, isolate the line driving the drop, and make one concrete change before the next client cycle.
If you want a deeper dive, read A Guide to QuickBooks Self-Employed for Freelancers.
What should you prepare before running the report?#
Before you run the report, confirm your plan, clean your Chart of Accounts, and set a clear review window and objective. The goal is consistency. When your inputs stay clean, your P&L becomes something you can act on, cycle after cycle.
| Prep step | What to do | Check |
|---|---|---|
| Plan and report view | Name your plan and locate the report options you will use this cycle | Plan tiers do not expose the same report set, and layouts can differ between classic and enhanced report experiences |
| Chart of Accounts | Keep Income Accounts for inflows and Expense Accounts for spending | Each major revenue and cost line lands in the section you expect |
| Balance Sheet and P&L | Open Balance Sheet and P&L side by side | Explain whether a change reflects timing, classification, or a real operating shift |
| Period and objective | Choose a clear pass type, then document it in your notes | Weekly and monthly reviews can both work, depending on how your business operates |
Step 1. Confirm your QuickBooks Online setup and report experience. Check which subscription tier you use (for example, QuickBooks Online Simple Start, Essentials, or Plus) before you start. Plan tiers do not expose the same report set, and layouts can differ between classic and enhanced report experiences.
- Verification point: You can name your plan and locate the report options you will use this cycle without hunting through menus.
Step 2. Clean your Chart of Accounts before analysis. Treat account mapping as a control step, not admin cleanup. The Chart of Accounts organizes balances, and account type classification drives where transactions appear in financial reports. Keep Income Accounts for inflows and Expense Accounts for spending so your P&L reflects real operating patterns.
- Verification point: Each major revenue and cost line lands in the section you expect.
- Hypothetical scenario: You tag a client payment to an expense account by mistake. Your next review understates income and pushes the wrong pricing decision.
Step 3. Open Balance Sheet and P&L side by side. A Balance Sheet shows a snapshot as of a specific date. A Profit and Loss (P&L) Statement summarizes performance over a specific period. Use both views together to flag possible timing mismatches instead of reacting to one report in isolation.
- Verification point: You can explain whether a change reflects timing, classification, or a real operating shift.
Step 4. Set the report period and operating objective before you click Run. Choose a clear pass type, then document it in your notes. Weekly and monthly reviews can both work, depending on how your business operates.
| Review pass | Primary objective | Decision focus |
|---|---|---|
| Weekly triage | Catch drift early | Billing issues, classification errors, unusual spend |
| Monthly close | Confirm operating performance | Margin trend, cost control, pricing follow-ups |
This prep routine keeps signal quality high, so you can run the report fast and trust what you see.
How do you run a profit and loss report in QuickBooks in under five minutes?#
Run Profit and Loss Detail from a saved view, then validate Income and COGS before you act. If you did the prep in the last section, this becomes a repeatable runbook, not a scavenger hunt.
Step 1. Open the right report for your product version. In QuickBooks Online, go to Reports and choose Profit and Loss Detail (commonly listed in Business overview). If you work in Desktop, the path is Reports then Company & Financial then Profit & Loss Detail. Make sure your plan and product version include the view you expect.
Step 2. Set the date range and run the report. By default, the report is fiscal year to date, so set the period that matches your review objective, then refresh.
Step 3. Save your customization immediately. Apply your standard filters and layout, then save that view. Consistent views make trend checks cleaner and faster.
Step 4. Validate critical lines before making decisions. Scan Income Accounts first, then check Cost of Goods Sold in its own section between Income and Expenses. If either line looks out of pattern, pause decisions and fix classification first.
Step 5. Capture a lightweight audit snapshot. Export to Excel or save as PDF right after review. Name the file with the period and pass type so you can trace what you saw and what you changed.
| Fast control check | What to confirm | Why it matters |
|---|---|---|
| Report selection | You opened Profit and Loss Detail, not a summary by mistake | Detail lines support real diagnostics |
| Filter consistency | Date range and saved view match prior cycles | Comparable metrics across periods |
| Line validation | Income and COGS sections look correctly classified | Prevents bad pricing or spend decisions |
| Snapshot saved | PDF or Excel file stored with clear period label | Creates a simple audit trail |
For example, revenue looks strong, but COGS spikes after a vendor recode. Because you ran this checklist, you catch the mapping issue before you change pricing or cut necessary delivery spend.
Want a quick next step after the review? Try the free invoice generator.
What does each line in your P&L actually tell you about payment risk?#
Read the P&L in a fixed order so you see revenue quality first, margin pressure second, and cash-friction signals third. This is where your QuickBooks routine stops being bookkeeping and starts becoming operating control.
Step 1. Start with Income Accounts. Top-line movement can reflect real demand, or it can be timing noise that increases payment risk. Ask direct questions: is this change repeatable, or is it timing-related?
Step 2. Measure gross profit pressure with Cost of Goods Sold. Use the formula Gross Profit = Revenue - Cost of Goods Sold (COGS). If income holds but COGS climbs, treat it as margin pressure first, then adjust scope, sourcing, or pricing.
Step 3. Audit Expense Accounts for silent margin loss. Expense accounts help you track spending. Look for recurring costs that quietly erode margin across reporting cycles.
Step 4. Cross-check customer profitability with the right scope. The Invoice Profitability by Customer report (QuickBooks Desktop Enterprise) helps you see which invoices and customers generate the most profit. It does not include overhead or operating expenses, so pair it with your Profit and Loss (P&L) Statement before you change pricing.
Step 5. Reconcile P&L trends with Balance Sheet movement. Customer payments can affect Accounts Receivable and bank accounts without appearing in P&L lines. Compare P&L trends with Balance Sheet shifts to catch collections friction and cash-conversion risk.
| Line to read | Risk signal | Immediate action |
|---|---|---|
| Income Accounts | Revenue timing or concentration risk | Confirm invoice timing and client mix |
| Cost of Goods Sold | Delivery margin compression | Review direct costs before cutting core spend |
| Expense Accounts | Recurring spend eroding margin | Trim nonessential recurring costs |
| Balance Sheet vs P&L | Collections lag and cash friction | Follow up receivables before next cycle |
For example, one client looks highly profitable at invoice level, but collections slow while overhead rises. You catch the gap by pairing that view with your P&L, then adjust terms before cash flow tightens.
How do you turn P&L findings into better client terms and safer pricing?#
Turn P&L signals into default pricing and term guardrails before each negotiation. The goal is to stop renegotiating from scratch every time. Let the numbers set your guardrails.
Step 1. Translate margin compression into contract guardrails. If your Income Statement trend shows shrinking profit while delivery effort rises, tighten terms and pricing guardrails before accepting new requests. Tighten scope language, define what counts as out-of-scope work, and consider phased approvals where appropriate so extra work does not hide inside fixed fees.
- Verification point: You can point to one updated clause that prevents unpriced rework in the next engagement.
Step 2. Use client-level profitability evidence, then check full business context. The Invoice Profitability by Customer report shows your profit for each invoice. It also helps you identify which customers generate stronger gross profit.
It does not include overhead or operating expenses, so pair it with your profit and loss view before changing prices. In QuickBooks Online, use customer-level reports such as Profit and Loss by Customer to compare client performance, including revenue mix.
- Verification point: You can separate "high revenue" clients from "high profit" clients without guessing.
Step 3. Build a simple pricing rule set tied to metrics. Use directional triggers, not gut feel. Write the rule set down so you can apply it the same way next cycle.
| Signal from your review | Risk interpretation | Default action |
|---|---|---|
| Revenue rises, profit falls | Delivery-cost or discount pressure | Reprice new work and narrow scope options |
| Stable revenue, rising expenses | Cost-structure pressure | Review operating costs before discounting |
| Strong invoice gross profit, weak total P&L | Overhead pressure | Hold margin targets and adjust service mix |
Step 4. Align solo operations with your bookkeeping workflow. If you run a one-person shop, build this rule set into your QuickBooks Self-Employed routine. Keep income and expense tracking clean so periodic pricing reviews and Schedule C prep stay easier.
Keep one operating playbook, then deepen your pricing model with Value-Based Pricing: A Freelancer's Guide.
For example, a client asks for a lower rate and faster turnaround. Your P&L already shows margin pressure, so you protect price integrity and narrow scope first, then choose term changes that fit the engagement.
Why does your report look wrong and how do you recover fast?#
If your report looks wrong, run diagnostics on filters, basis, and source transactions before you edit anything. If your inputs are off, your pricing and spending decisions will be off with them.
| Check | What to review | Note |
|---|---|---|
| Report date ranges | Match report date ranges across the QuickBooks reports you compare | Do this before you touch any transactions |
| Accounting basis | Match accounting basis before you judge differences | Do this before you touch any transactions |
| Sales-item mapping | Check sales-item account mapping, then check for transactions posted without items | Do this before you touch any transactions |
| Inventory behavior | Validate only if Inventory Tracking is enabled | Expect Cost of Goods Sold in its own section between Income and Expenses |
Before you start, capture your current view so you can compare before and after changes.
Step 1. Confirm the symptom using a known pattern. If Sales and Services appears duplicated, start with source transactions, not account edits. In QuickBooks Online, check whether bank-feed activity was added to the register instead of matched to existing entries, and use the Distribution Account filter to narrow what you are reviewing.
- Verification point: You can identify the exact transactions creating the duplicate effect before changing settings.
Step 2. Run the three-step recovery loop in order. Use this sequence before you touch any transactions.
- Match report date ranges across the QuickBooks reports you compare.
- Match accounting basis before you judge differences.
- Check sales-item account mapping, then check for transactions posted without items.
This sequence catches common errors quickly and keeps your P&L interpretation grounded in actual posting behavior.
Step 3. Validate inventory behavior only if Inventory Tracking is enabled. Inventory settings change how lines appear in the Profit and Loss (P&L) Statement. Expect Cost of Goods Sold in its own section between Income and Expenses, and confirm that line placement reflects setup before assuming an error.
| Report symptom | Likely driver | First action |
|---|---|---|
| Duplicate Sales and Services lines | Add-versus-match error or duplicate posting | Trace source transactions before edits |
| P&L mismatch versus sales view | Date range or basis mismatch | Align period and accounting basis |
| Unexpected COGS presentation | Inventory Tracking behavior | Confirm inventory setup and item mapping |
Step 4. Escalate with discipline and log the fix. If the view still looks wrong, cross-check targeted guidance in QuickBooks Help and relevant threads in QuickBooks Community. Document what you checked, what you changed, and what resolved the issue so next cycle runs faster.
For example, you spot duplicated revenue right before a pricing review. You run this loop, find a matching error, correct the source entry, and avoid changing terms based on bad data.
What weekly and monthly cadence keeps this system reliable?#
Do weekly Profit and Loss Detail triage, then reconcile your monthly P&L against the Balance Sheet and your account map. This cadence keeps the report decision-ready without turning every week into accounting day.
| Cadence | Report to run | Decision focus | Verification point |
|---|---|---|---|
| Weekly | Profit and Loss Detail | Catch billing, fee, and classification drift early | You leave with a short action list for this week |
| Monthly | Profit and Loss (P&L) Statement + Balance Sheet | Confirm category accuracy and financial consistency | You can explain major variances and close with confidence |
Step 1. Run weekly triage in QuickBooks Online. Open Reports, run Profit and Loss Detail, and compare your current period against a prior week, month, or year view when needed.
Look for line-level anomalies first. Examples include unexpected fee growth, income posted to the wrong bucket, or expense categories that no longer match how you work. If a report view looks different than expected, confirm your plan includes the report and view you are trying to use.
Step 2. Reconcile monthly at one date boundary. Run your P&L for the month and your Balance Sheet as of the same end date.
Then confirm your Income Accounts and Expense Accounts still reflect your real workflow, not an old setup. Remember the Balance Sheet is an as-of-date snapshot, and equity includes fiscal-year-to-date net income.
Step 3. Keep a compact issue log. Track symptom, root cause, fix, and the related note you used in QuickBooks Help or QuickBooks Community. Keep it short enough to review during weekly triage.
For example, you see recurring fee drift from a payment app category, review your prior notes, and speed up troubleshooting before deciding on a fix.
Use this copy and paste checklist before every client cycle#
Run this five-step checklist in order so every client decision comes from clean, comparable numbers. This is the same playbook you just read, compressed into an execution sequence.
| Step | What to do | Key point |
|---|---|---|
| Run Profit and Loss Detail | Open Reports, select Profit and Loss Detail, set the date range, and run it | Use one consistent period definition across cycles so trend checks stay valid |
| Validate top lines | Check Income Accounts, Cost of Goods Sold, and Expense Accounts first | Each major movement has a business reason you can state in one sentence |
| Investigate anomalies | Check report filters, date range, accounting basis, account mapping, and source transaction handling | Confirm whether bank feed activity was added when it should have been matched |
| Convert findings | Update scope terms, billing cadence, and client review priorities | Use Invoice Profitability by Customer report for client-level gross profit context, then pair it with your P&L so overhead stays in view |
| Close the loop | Save your customized report view and export a copy when needed | Write a short note on what changed, why it changed, and what you will verify next cycle |
Before you start, confirm your plan includes the report view you want, especially Detail versions. Then run the list straight through.
- Run Profit and Loss Detail with the right period. In QuickBooks Online, open Reports, select Profit and Loss Detail under Business overview (if your plan supports it), set the date range, and run it. Use one consistent period definition across cycles so trend checks stay valid.
Verification: You can see line-level transactions, not only totals.
- Validate top lines before you make decisions. Check Income Accounts, Cost of Goods Sold, and Expense Accounts first. Use a simple control rule: revenue minus expenses must align with the profit or loss story you think happened.
Verification: Each major movement has a business reason you can state in one sentence.
- Investigate anomalies before you edit categories. If Sales and Services lines look duplicated, check report filters, date range, accounting basis, account mapping, and source transaction handling. Specifically confirm whether bank-feed activity was added when it should have been matched.
Verification: You identify the likely pattern before you post fixes, and you document what you checked in QuickBooks Help or QuickBooks Community notes.
- Convert findings into this cycle's actions. Update scope terms, billing cadence, and client review priorities from the report output. Use Invoice Profitability by Customer report for client-level gross profit context (if available in your plan), then pair it with your P&L so overhead stays in view.
Verification: You leave with clear client actions, not just cleaner numbers.
- Close the loop with a saved snapshot and next check. Save your customized report view and export a copy when needed. Write a short note on what changed, why it changed, and what you will verify next cycle. For example, you spot a margin dip, trace it to misclassified delivery costs, correct the mapping, and adjust one client scope line before sending the next invoice.
Frequently Asked Questions
What is a profit and loss report in **QuickBooks**?
A profit and loss report in QuickBooks tracks revenue, expenses, and net profit or loss for a selected period. QuickBooks also labels this as a Profit and Loss (P&L) Statement. Use it as an operating view for profit trends and day-to-day decisions.
How do I run **Profit and Loss Detail** in **QuickBooks Online**?
Open Reports in QuickBooks Online and choose Profit and Loss Detail under Business overview. Set the reporting period you want, then run the report. Validate it by scanning the line-level transactions, not just totals, so you catch classification drift quickly.
What is the difference between a **Profit and Loss (P&L) Statement** and an **Income Statement**?
In QuickBooks, these terms refer to the same core report. Both summarize operating performance over a period, not at a single date point. Pick one label and keep it consistent in your process notes.
What do **Cost of Goods Sold**, **Income Accounts**, and **Expense Accounts** mean in practice?
Income Accounts capture money coming into the business. Expense Accounts capture costs to run the business. Cost of Goods Sold captures direct costs tied to what you sell, and QuickBooks Online uses a default COGS account with the detail type Cost of Goods Sold for inventory item costs. These account types determine where activity appears in your Profit & Loss and Balance Sheet reports.
Why does my report show duplicate **Sales and Services** transactions?
Do not assume one root cause. Duplicate-looking lines can come from report setup choices, and QuickBooks guidance points to checking report filters first. Then trace the source transactions before you edit accounts.
Which **QuickBooks Online** plans are commonly used for this workflow, such as **QuickBooks Online Essentials** or **QuickBooks Online Plus**?
QuickBooks documentation lists report availability across Simple Start, Essentials, and Plus, with broader access in higher tiers like Advanced. Confirm the exact reports you need in your plan before you standardize your review cadence.
When should I also review **Balance Sheet** data with my P&L?
Review them together whenever a P&L shift affects a cash or equity decision. Your P&L summarizes a period, while the Balance Sheet gives a snapshot as of one date. Use the same end date on both reports so your interpretation stays clean and your next action is clear.
Try a related tool
Researched and edited by the Gruv editorial team. Gruv builds cross-border billing, payouts, and finance-operations software for global businesses.
Sources
Includes 1 external source outside the trusted-domain allowlist.
Educational content only. Not legal, tax, or financial advice.
Related Posts

Value-Based Pricing for Freelancers Under Real Payment Risk
Value-based pricing works when you and the client can name the business result before kickoff and agree on how progress will be judged. If that link is weak, use a tighter model first. This is not about defending one pricing philosophy over another. It is about avoiding surprises by keeping pricing, scope, delivery, and payment aligned from day one.

A Guide to QuickBooks Self-Employed for Freelancers
**QuickBooks Self-Employed can support basic bookkeeping, but predictable cashflow comes from your payment controls, not invoicing alone.**

The Freelance Payment Penalty: A Modeled Audit of Platform Fees, FX Spreads, and Payout Delays
The money rarely disappears through a single, easy-to-spot fee. The real loss is stacked. A marketplace takes its commission, a processor adds a charge for international cards, a bank or payment company converts the currency at a spread, a platform holds the funds before release, and a wire sheds a little to intermediaries on the way in. Each layer looks defensible on its own, but the worker feels the combined result as a smaller deposit and a later payday.