
Quick Answer
Start by assigning metric ownership, locking KPI definitions, and naming one reporting record before you automate anything. Build in Looker Studio for presentation, use native sources for simpler GA4 or Google Ads setups, and add Supermetrics when recurring non-Google channels are required. Blend data for ROAS or CAC only after source definitions reconcile. Tie the dashboard to your SOW and review agenda, then deliver on schedule only after checks on date range, connector health, and headline totals.
The Client Reporting Flywheel: A 3-Part Framework for Proving Value, Mitigating Risk, and Driving Growth with Looker Studio#
If clients rarely engage with your reports, your value story feels fuzzy, and month-end reporting keeps eating into paid work, the fix is usually not more charts. It is tighter operating discipline. The Client Reporting Flywheel is a practical model for turning reporting into three linked outcomes: proof of value, clearer scope control, and better growth planning.
| Part | How the report is used | Main outcome |
|---|---|---|
| Part 1 | Reporting ties activity to business outcomes | Prove value |
| Part 2 | Use the report as a shared record of what is being measured and discussed | Scope is easier to manage |
| Part 3 | Use trends, gaps, and recurring questions to surface growth opportunities worth proposing | Growth planning |
For consistency, I'll use Looker Studio throughout this article. In this setup, treat the dashboard as the presentation layer and your data pipeline as the delivery layer. Your actual reporting process still owns metric definitions, review steps, and client decisions. That separation matters because a tool-first rollout can amplify a broken process instead of fixing it.
Step 1#
Start with accountability, not automation. Before you build or refresh a dashboard, decide who owns each metric, which source is authoritative, who reviews the report before it goes out, and what question the report is supposed to answer.
Use a simple checkpoint. Can you trace every number on the page back to a named source and a named owner? If more than one function touches the data, get the relevant people into one short working session. Depending on your setup, that may include legal, HR, marketing, operations, and IT or security. If nobody agrees on what a metric means, automation just repeats the disagreement faster.
Step 2#
Measure the reporting process, not just the client's performance data. TrustArc's 2024 benchmark found that organizations actively measuring program effectiveness score 31 percentage points higher in its index. You do not need to map that result directly onto agency reporting, but the lesson holds. If you never measure whether reporting is working, you will not know what to fix.
For client reporting, keep the checks simple. Track whether the report went out on time, whether the core metrics reconciled cleanly, whether the client had a clear next action, and whether clarification emails dropped over time. A common failure mode is the silent dashboard. The data is there, but no decision is attached to it.
Step 3#
Use the flywheel in the order you will use it in real work. First, prove value with reporting that ties activity to business outcomes. Second, use that same report as a shared record of what is being measured and discussed, so scope is easier to manage without turning every disagreement into a subjective debate. Third, use trends, gaps, and recurring questions to surface growth opportunities worth proposing.
That sequence sets up the rest of the article. In Part 1, you will decide what belongs in a report that proves value. In Part 2, you will make the report dependable enough to protect your time. In Part 3, you will turn reporting from a recap into planning input. If your current report cannot show one outcome, one boundary, and one next recommendation, fix the structure before you add more automation.
If you're trying to automate client reporting in Google Data Studio, browse Gruv tools.
Part 1: The Value Engine - Build Reports That Scream "ROI"#
Build this section in executive order: outcome first, explanation second. If you lead with activity metrics, you force a debate about clicks and impressions instead of a decision about business impact.
| Business model | Prioritize | Secondary context only |
|---|---|---|
| Ecommerce | revenue and efficiency views (for example, ROAS when media efficiency is the goal) | clicks, sessions, CTR, engagement rate, and organic impressions |
| Lead generation | qualified leads, cost per lead, or downstream value when available | clicks, sessions, CTR, engagement rate, and organic impressions |
| Subscription | trial-to-paid movement and acquisition efficiency | clicks, sessions, CTR, engagement rate, and organic impressions |
Step 1. Choose outcome KPIs by business model, then add diagnostics. Start with the result the client is paying you to improve, then map supporting metrics behind it.
- Ecommerce: prioritize revenue and efficiency views (for example, ROAS when media efficiency is the goal).
- Lead generation: prioritize qualified leads, cost per lead, or downstream value when available.
- Subscription: prioritize trial-to-paid movement and acquisition efficiency.
- Secondary context only: clicks, sessions, CTR, engagement rate, and organic impressions.
Use a quick opening-page test: can the client answer, in about 30 seconds, what happened, what it cost, and what to do next?
Step 2. Lock definitions before you build calculated fields. Calculated fields help only after you settle definitions. Keep ROAS and ROI as separate scorecards unless the client has explicitly approved one blended business formula.
Before publishing any client-facing scorecard, verify:
- metric definitions for top-line numbers (lead, sale, revenue event, refund, qualified conversion)
- attribution logic alignment across combined sources
- naming consistency (campaigns, source/medium labels, account names) so joins do not fragment data
- date range and currency alignment, then reconcile totals back to source data
Raw numbers from GA4, Search Console, and other platforms do not explain themselves. If you skip context checks, you can react to noise and weaken trust.
Step 3. Choose the connector path by reporting job, not tool preference. Pick the path that gives you the field coverage your KPI definitions require and a reporting process you can maintain.
| Setup path | Connector path | Typical use case | Maintenance effort | Reporting reliability |
|---|---|---|---|---|
| Native Looker Studio source | Source to Looker Studio | One primary platform or common Google sources with straightforward scorecards | Lower | Reliable when source fields already match required KPIs |
| Connector tool such as Supermetrics | Source to connector to Looker Studio | Broader source coverage or more consistent pulls across client accounts | Medium | Reliable when field mapping is documented and reviewed |
| Blended scorecard | Native and connector-fed sources blended in Looker Studio | Executive summary combining spend, site behavior, and conversion outcomes | Higher | Strong for decisions only when join keys and definitions reconcile |
Automate delivery only after manual QA passes. Scheduled emails and dashboard delivery improve consistency, but they will also repeat bad logic if your scorecard is wrong.
Step 4. Make every major chart follow Problem-Action-Result. Use one annotation workflow across the report:
- mark the problem or opportunity
- mark the dated action you took
- mark the measured result after enough time to interpret movement
Then use a short monthly narrative: "We saw [problem/opportunity]. We changed [action] on the change date. The early result is [movement] against [outcome KPI]. Next month we recommend [decision]."
This keeps multi-source reporting decision-ready instead of chart-heavy. You might also find this useful: SEO Client Reporting That Drives Better Client Decisions.
Part 2: The Defensive Moat - Protect Your Time and Profitability#
Use your reporting system as the operating record for scope decisions, not just a place to display results. You protect margin when the dashboard, your agreement, and client communication all reference the same source of truth.
Step 1. Make one dashboard the single source of truth#
Choose one named dashboard and repeat that exact name and link in every working document: proposal/SOW, kickoff notes, review agenda, and any scope-change request. If you are inconsistent here, side exports and one-off screenshots start competing with your core record.
Use this implementation checklist:
- Name the dashboard and assign one owner
- Lock the KPI definitions agreed in Part 1
- State that reviews and recommendations are based on this dashboard
- State that new requests are handled through reprioritization or a scope update path
Quick validation:
- Which report is the reference?
- Where does a new request go?
If either answer is unclear, decision quality drops and reporting debates replace planning.
Step 2. Set boundaries by engagement type#
Define boundaries in the report so scope changes are handled as decisions, not surprises.
| Engagement setup | Boundary metric to show | Alert trigger | Follow-up action |
|---|---|---|---|
| Retainer | Active priorities and work queue status | A new request would displace agreed priorities or require new tracking inputs | Ask the client to swap priorities or approve added scope |
| Fixed-scope project | Deliverables, milestone status, and revision status | A request adds deliverables, changes success criteria, or expands measurement needs | Route the request through a scope-change workflow before execution |
| Audit or sprint | Agreed outputs and review rounds | The client requests implementation, ongoing monitoring, or custom reporting outside the original output | Convert it into a follow-on engagement with a separate plan |
Reusable script framework:
- Acknowledge the request: "That request makes sense."
- Anchor to the operating record: "It sits outside what we track in [dashboard name]."
- Offer two paths: "We can replace an existing priority, or scope this as an add-on."
- Ask for a decision: "Which path do you want?"
Step 3. Run access and review as a routine#
Treat access governance as a repeatable operating habit. Tool choice will vary by stack, budget, and growth stage, so keep your process explicit and simple.
If your reporting depends on sources like GA4 and GSC, maintain a lightweight access log:
- Who has viewer access
- Who owns the connected data sources
- When access was last reviewed
For client offboarding, complete the same checklist each time:
- Remove contacts who no longer need access
- Remove external collaborators no longer in scope
- Confirm who owns each live data connection
- Send a final handoff summary
Keep a short report footer to reinforce trust through process:
- Confidentiality note
- Access owner
- Last review date
Close each review with a prioritized action list so the dashboard stays operational instead of archival.
If you want a deeper dive, read The Best Analytics Tools for Your Freelance Website.
Part 3: The Growth Catalyst - Find Your Next Upsell in the Data#
Use your monthly report to drive the next decision, not just recap performance. In each review, move in order: what happened, why it happened, what should happen next. Your dashboard can automate compilation, but you still need to interpret the signal and recommend the action.
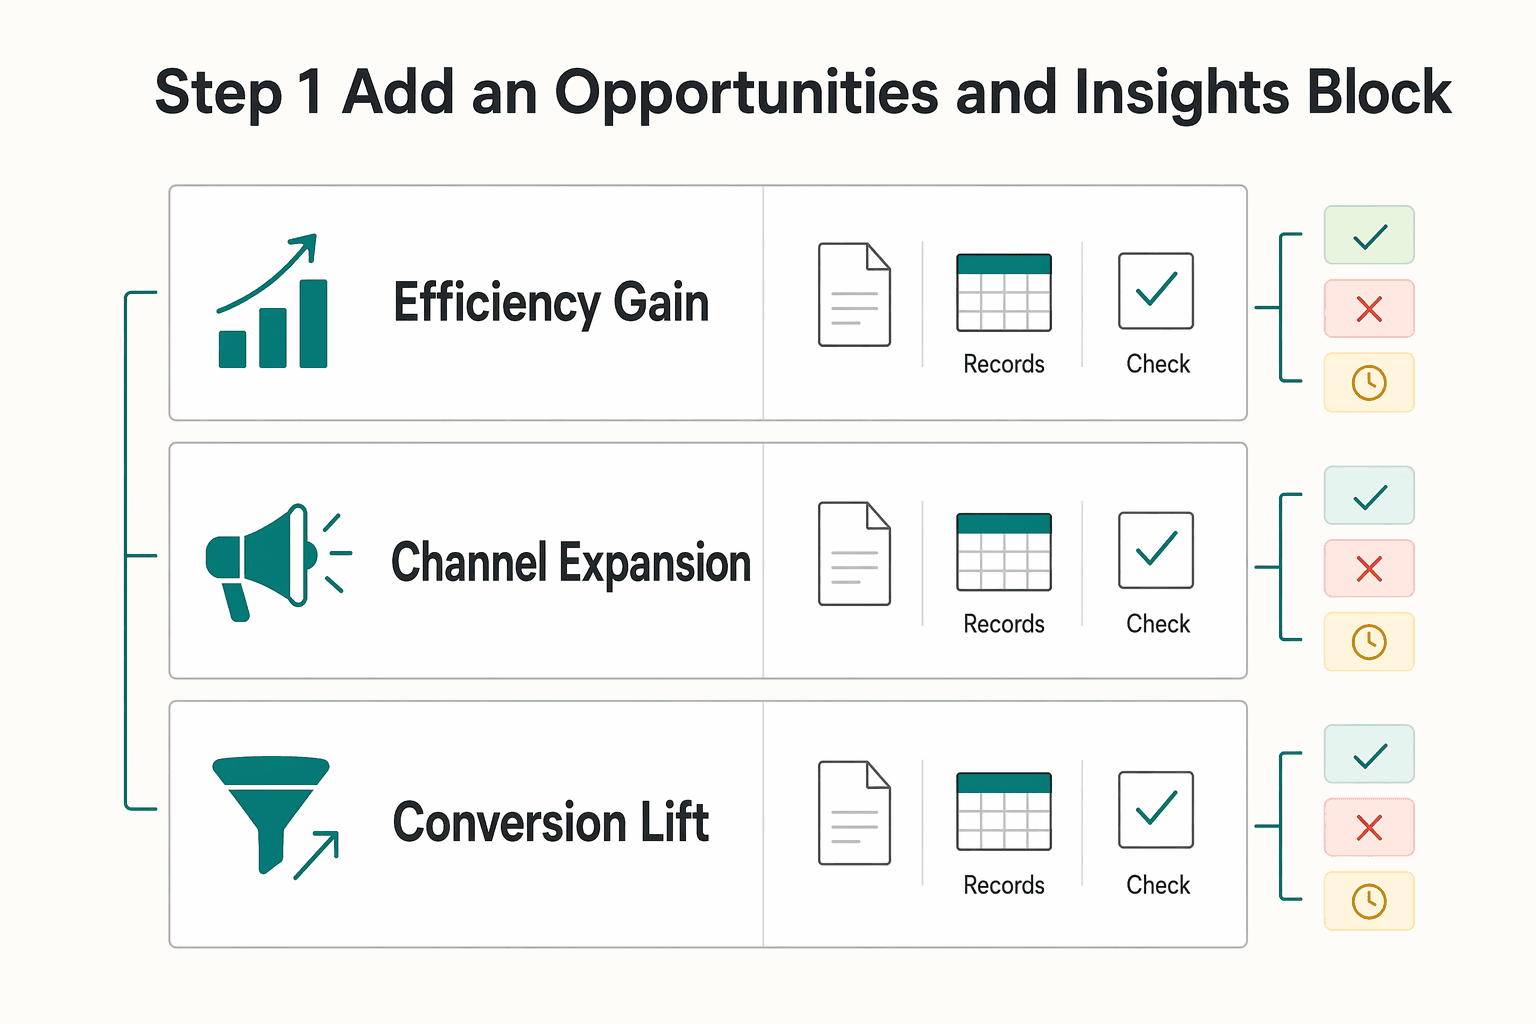
Step 1. Add an Opportunities and Insights block#
Add one fixed summary block called Opportunities and Insights and complete it every cycle. Keep the same four fields so each recommendation is decision-ready:
- Signal observed
- Likely business impact
- Recommended action
- Decision needed from client
Write it so the client can approve, reject, or defer without extra clarification. Focus on outcomes and business impact, not just activity metrics.
| Opportunity type | Required inputs | Confidence level | Expected outcome |
|---|---|---|---|
| Efficiency gain | Current spend, waste indicators, baseline CPA/CPL, current benchmark pending source-record verification | Set after data-quality and stability check | Better budget use or lower waste |
| Channel expansion | Current channel mix, assisted-conversion view, source/segment trend, current benchmark pending source-record verification | Set after enough history is confirmed | Qualified demand from an underused channel |
| Conversion lift | Funnel or landing-page data, current conversion rate, friction points, current benchmark pending source-record verification | Set after tracking reliability is confirmed | More conversions from existing traffic |
Use a simple quality check before presenting any recommendation: include the source, date range, and benchmark note. If those are missing, treat it as a draft, not a proposal.
Step 2. Run trend analysis with trigger-and-response#
Trend analysis is useful only when it triggers a concrete test plan. Use this workflow each month:
| Trigger | Response |
|---|---|
| Plateau in a core metric | Propose one new growth input (for example: creative refresh, landing-page variant, or nurture sequence test) |
| Demand shift by segment, geography, or source | Propose a targeted budget or messaging adjustment for that segment |
| Mix changes without outcome gains | Pause expansion and diagnose quality before recommending more spend |
For every response, define owner, timeline, and success measure. If those are not clear, hold the upsell recommendation until they are.
Step 3. Turn the what-if dashboard into a scoped proposal#
Build a private scenario version of your report before you pitch next scope. This keeps the recommendation risk-aware and easier to approve.
Include four parts:
- Assumptions log: current benchmarks, exclusions, and any uncertain inputs marked clearly
- Scenario ranges: conservative, expected, and upside cases
- Dependency checklist: tracking, creative, landing pages, approvals, and access
- Client-ready summary: projected impact, implementation effort, and the exact decision needed
Present scenario ranges instead of a single-point forecast so your recommendation stays grounded in uncertainty and execution reality. If you want your commercial model to match this approach, read Value-Based Pricing: A Freelancer's Guide.
This pairs well with our guide on How to Create a Social Media Report for a Client.
Keeping the Flywheel Spinning: From Reports to a Scalable System#
To scale reporting without quality drift, run one standard Looker Studio system: a master template, a phased client handoff, and a recurring quality-control loop.
Step 1. Define template boundaries and change control#
Keep one master report for your global defaults, then document what can vary by client.
- Global defaults: layout, chart logic, naming conventions, summary structure, and recurring sections.
- Client-specific overrides: approved KPIs, channel mix, benchmark views, date comparisons, and any custom pages.
Before rolling out template changes, document your approval path and test process on a copy first. Verify the approver role from current approval records before anyone uses the SOP.
| Update method | Typical risk to existing reports | Typical effort | When to use |
|---|---|---|---|
| Shared data source update | Higher (one change can affect many reports) | Lower after setup | Standard metric logic you want consistent across clients |
| Per-report edit | Lower blast radius | Higher over time | Client exceptions or one-off presentation needs |
| Connector-level change | Medium to high (upstream schema/connection changes can alter data) | Medium | Reconnects, broken fields, or source-structure changes |
Step 2. Onboard with a phased handoff#
Use the same handoff sequence for every client so setup errors do not turn into reporting errors.
- Access setup: confirm credentials and data connections, including Supermetrics + Sheets where used.
- KPI definition: get written agreement on success metrics and comparison periods.
- QA review: validate totals, date ranges, filters, and anchor traffic inputs (sessions, pageviews, bounce rate, top sources).
- Delivery cadence: record send dates, review rhythm, and service expectations. Verify the current SLA from the client agreement or source records before use.
- Client training: show where key decisions live in the dashboard and what to flag between reviews.
Step 3. Run a lightweight recurring QC loop#
Before each send, run pre-send checks: date controls, connector status, and headline metric alignment with source platforms. Then keep a weekly 30-minute anomaly review to catch bottlenecks or breaks early.
If data fails, use a simple escalation path: pause commentary on affected metrics, log the issue, assign an owner, notify the client about impact, and set the next recheck time. This keeps reporting decision-ready instead of reactive.
Done consistently, this gives you fewer reporting errors, clearer expectations, and easier scaling as your client load grows.
For a step-by-step walkthrough, see How to Automate Client Gift Sending with a Gifting Platform.
Conclusion: Your Report Is Your Reputation#
Once you have chosen the lightest setup that still holds up, the job is straightforward: repeat the same client-facing sequence every cycle. Automation can compile the data, but your reputation is built on how you interpret it, define the reporting record, and set the agenda for what happens next.
Step 1#
Prove outcomes first. Start from one standard template in Looker Studio. Make sure every delivery answers the same three questions: what happened, why it happened, and what should happen next. The checkpoint is simple. If a client can only see scorecards and charts, the report is not finished. Automated dashboard reports save time, but they do not explain performance on their own.
Step 2#
Clarify scope with the report record. Use the report as the written reference for the review period, and annotate decisions inside the report or in the meeting notes you send with it. That keeps performance conversations tied to documented results instead of memory or opinion. If you send only a dashboard link, the client may fill in the story themselves, and you can end up defending work that was never framed clearly.
Step 3#
Surface the next opportunity. Every cycle should end with one recommended next action, even if the answer is to stay the course for another period. That is the part of data storytelling that stays human and cannot be fully automated.
| Provider model | Partner model | Why it matters |
|---|---|---|
| Sends a dashboard | Sends an annotated reporting record | Fewer gaps in interpretation |
| Recaps metrics | Links results to causes | Better review conversations |
| Waits for requests | Proposes the next test or action | Clearer path for future work |
Implement this now: standardize one template, one insight annotation routine, and one recommendation handoff in [your PM tool or client notes doc]. If you want to automate client reporting in Google Data Studio, it can handle the build, but you still need to own the story.
We covered this in detail in How to Automate Client Onboarding with Notion and Zapier.
Frequently Asked Questions
How do I choose between native Looker Studio sources, manual imports, and connector-based automation?
Start with native sources when you have a simple setup such as one GA4 property, one Google Ads account, or a straightforward BigQuery table. Use a Google Sheets import or file upload when the data is occasional and you can tolerate manual updates, but expect repeat effort and potential version drift. Move to a third-party connector when you need recurring data from non-Google channels. If your report depends on heavy transformations across many sources, remember that Looker Studio is a visualization layer, not a full data integration platform.
How do I add a new data source without overcomplicating the report?
Add the source only when it answers a reporting question you already care about. Click Add data and search for the source you need before you build charts around assumptions. Native options include Google Ads, Google Analytics, Google Sheets, YouTube, Google Search Console, file uploads, and MySQL. If the source is not native, that is your decision point: use a connector for recurring pulls or keep it manual if the volume is low and the reporting cadence is infrequent.
When should I use blended data for ROI or ROAS reporting?
Use a blend only when you need spend and outcome metrics in the same chart or scorecard, such as ROAS or CAC. Validate your blend setup and metric definitions before you trust the result. If source definitions differ, treat the blended view as directional until you reconcile those definitions with the client.
Which KPIs should lead the report?
Put the business outcome first, then pair it with one diagnostic KPI that explains movement. That keeps the report useful for decisions instead of turning it into a traffic summary. | Business model | Primary outcome KPI | Diagnostic KPI | Reporting caveat | | --- | --- | --- | --- | | E-commerce | ROAS | CAC | Keep revenue and spend sources consistent or the headline ratio will drift | | B2B/SaaS | MQL volume or cost per MQL | Lead-to-customer rate | Define what counts as an MQL in writing before you automate anything | | Subscription or SaaS growth | CAC | Trial-to-paid rate or pipeline created | Label whether the number comes from ad platforms, analytics, or CRM to avoid false comparisons |
How do I roll out one report template across many clients?
Create one master report, then make one copy per client account instead of trying to force many clients into one live report. Use a naming convention you can scan quickly, such as Client Name plus channel plus reporting cadence. After each copy is connected, check the date range filter and a few anchor metrics before you hand it over.
What is the safest way to share a report with a client?
Use the Share menu and keep a simple permission checklist that fits your workflow. Confirm viewer and editor access before delivery. The same menu also gives you shareable links, scheduled email delivery, and PDF downloads. Before you send the link, open it from a non-editor account so you can verify the client view and catch accidental edit access.
How often do reports refresh, and can I trust the timing?
Looker Studio reports update automatically every day. Plan routine commentary around that cadence unless you have confirmed something different in your connector setup. You can schedule regular email delivery from the Share menu, but a scheduled send does not prove the underlying data is fully reconciled. Do a quick pre-send check for stale fields, broken connectors, and obvious total mismatches.
What should I troubleshoot first when numbers do not reconcile?
Start with freshness and schema checks: confirm each source has updated and that no platform schema changes have broken fields. If the report blends multiple sources, validate the blend setup and metric definitions before interpreting gaps. If those checks do not explain the mismatch, pause commentary and inspect the upstream source or connector setup before you rewrite the story.
Try a related tool
Researched and edited by the Gruv editorial team. Gruv builds cross-border billing, payouts, and finance-operations software for global businesses.
Sources
Includes 7 external sources outside the trusted-domain allowlist.
- farmingdale.edu/courses/index.shtmltrusted
- aeoengine.ai/blog/best-seo-report-tools-comparedexternal
- almcorp.com/blog/how-to-interpret-seo-dataexternal
- almcorp.com/blog/google-analytics-actionable-insights-co...external
- biddablemoments.com/blog/google-data-studio-open-your-eyes-to-re...external
- cloud.google.com/blog/products/ai-machine-learning/real-world...external
- cxl.com/blog/google-data-studio-reportingexternal
- dashboarddr.com/blog/how-to-automate-client-reports-google-d...external
Educational content only. Not legal, tax, or financial advice.
Related Posts

Value-Based Pricing for Freelancers Under Real Payment Risk
Value-based pricing works when you and the client can name the business result before kickoff and agree on how progress will be judged. If that link is weak, use a tighter model first. This is not about defending one pricing philosophy over another. It is about avoiding surprises by keeping pricing, scope, delivery, and payment aligned from day one.

The Best Analytics Tools for Your Freelance Website
Start with one sequence and keep it boring. Decide the business question. Choose one primary reporting source. Verify tracking against the origin. Then review it on the same day each week. That order matters more than which tool wins your shortlist.

The Best Meditation and Mindfulness Apps for Freelancers
Freelance work breaks generic wellness advice. Working for yourself demands responsibility and accountability, and your schedule shifts fast, context switching drains attention, and stress spikes when delivery risk climbs. As the CEO of a business-of-one, your mind is part of your delivery stack. You own the outcome, so your mindfulness routine has to protect energy and mental health during real deadlines, not just on calm days.