
Quick Answer
Use the ltv to cac ratio as a starting point, then turn it into a client decision system with CPQ: Quality-Adjusted LTV divided by True CAC. Build True CAC from acquisition time, personnel, and direct spend in one matched window, then reduce client value for late payments, scope creep, and unbilled cleanup. Review scores weekly to decide which accounts to retain, repair with tighter terms, or exit.
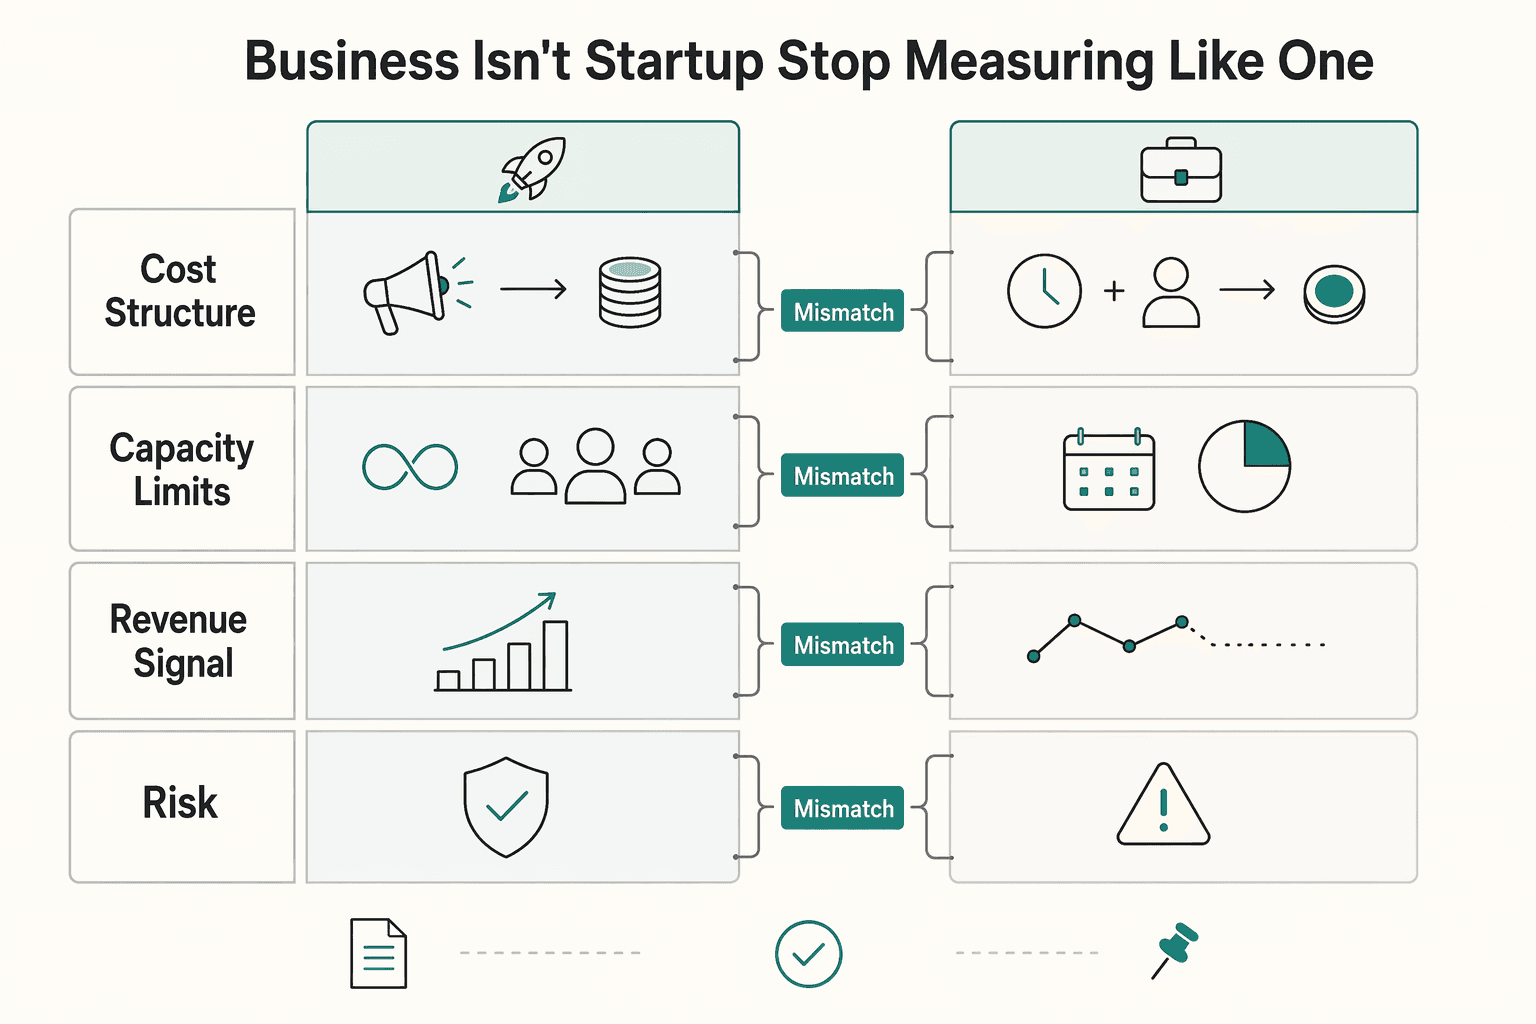
Your Business Isn't a Startup. Stop Measuring It Like One.#
If you run a service business, startup-style metrics can hide cashflow risk behind decent-looking revenue. The classic LTV:CAC ratio is common in startup and new-venture contexts, and CAC is usually built from sales and marketing spend. Your constraint is tighter: your time and when clients actually pay you.
Hours spent on discovery, proposals, follow-ups, and other non-billable work do not turn into billable revenue. In professional-services economics, non-billable operational and business-development time is overhead, and it cuts into the capacity you can sell. If you leave that cost out, client profitability will look better than it really is.
| What you are measuring | Startup-style assumption | Service-business reality |
|---|---|---|
| Cost structure | CAC is tracked through sales/marketing spend, including personnel and tools | Non-billable operating time also consumes real capacity, even when it is not billable |
| Capacity limits | Growth analysis can center on spend efficiency | Your billable capacity is finite, so overhead time directly crowds out paid work |
| Revenue signal | Revenue can look healthy on paper | Revenue depends on how much overhead and payment delay sit behind that revenue |
| Payment risk | Unit economics focus on value vs acquisition cost | Late invoices can create cashflow stress even when booked revenue looks fine |
Use a quick diagnostic: billable utilization rate (billable hours / total available hours x 100). If utilization drops while top-line revenue looks stable, your effective cost to win and serve clients is probably higher than a CAC-only view suggests.
Payment timing is the second blind spot. In QuickBooks' 2025 small-business report, 56% said they were owed unpaid invoices, with an average of $17.5K, and 47% reported some invoices overdue by more than 30 days. The same report links higher overdue exposure with more reported cashflow problems. Do not throw out LTV:CAC. Adapt it so it reflects time cost and payment-delay risk.
The first step is simple: calculate a truer baseline before you judge client profitability. If you want another example of working through a metric step by step, see How to Calculate and Manage Churn for a Subscription Business.
The Flawed Benchmark: Why the Traditional LTV:CAC Ratio Fails#
The traditional ltv to cac ratio can point you the wrong way in a service business. By definition, it compares lifetime value to acquisition cost, but the standard interpretation comes from SaaS-style setups where costs are cleaner and easier to separate.
In SaaS, teams often build CAC from fully burdened sales and marketing costs and allocate that spend between new acquisition and expansion work. You will also see shorthand like 3.0x+ for SaaS, though that benchmark is debated rather than universal. In service businesses, acquisition and delivery work can be more co-mingled, so those assumptions break quickly.
Two failure points matter most. First, acquisition effort is easy to undercount when it is not captured in fully burdened sales and marketing inputs. Second, if CAC is not allocated between new-customer acquisition and expansion activity, efficiency metrics can look better than they really are.
| Lens | Traditional interpretation | Business-of-one interpretation |
|---|---|---|
| CAC inputs | Fully burdened sales/marketing spend (often allocated between new vs expansion) | Include your real acquisition effort plus direct spend, or CAC is understated |
| Cost placement | Assumes cost components sit in clean buckets | Co-mingled roles can put costs in the wrong part of the equation and distort LTV:CAC |
| Decision risk | A ratio of 3.0x or higher may suggest efficient growth | A "good" ratio can still mislead if CAC is undercounted or misallocated |
Before you compare clients or make pricing calls, rebuild CAC around the effort and money you actually spend to win work. You might also find this useful: How to Calculate Customer Acquisition Cost (CAC).
Step 1: Calculate Your True Customer Acquisition Cost (CAC)#
Start with one number: what it costs you to win a new client in one matched time window. If your costs and your new-client count come from different periods, your CAC is less reliable for decision-making.
Use the same structure each cycle: True CAC = total acquisition costs / new clients won. For a solo operator or small team, consistency matters more than perfect precision. Run the same method monthly, quarterly, or annually, and keep the acquisition boundary tight.
What belongs in the calculation#
CAC should include only costs tied to winning new clients. Do not include post-sale delivery or support work, and use the same sequence every review cycle so your number stays comparable over time.
| Component | What to include | How to capture it |
|---|---|---|
| Sales and marketing work | Time spent on activities to win new clients (for example prospecting, discovery, follow-up, proposals, qualification) | Pull from your records for the chosen period and tag acquisition-only work consistently. |
| Personnel costs | Compensation tied to acquisition work, such as salaries, commissions, and bonuses | Use one consistent costing method for the full period so comparisons stay valid. |
| Hard costs | Direct acquisition spend such as advertising, software, and overhead tied to acquiring clients | Pull from bookkeeping categories and receipts; mark acquisition expenses so they are separate from delivery costs. |
| New clients won | Net-new paying clients acquired in that same period | Count only clients won in the selected window; do not use leads or proposals sent. |
Reusable three-step workflow#
| Step | What to do | Notes |
|---|---|---|
| Collect inputs for one period | Total acquisition costs for that window | Include personnel and direct acquisition spend |
| Validate the acquisition boundary | Include work done to win new business | Exclude delivery, support, infrastructure, and R&D |
| Compute per-client CAC | Divide total acquisition cost by new clients won | Use new clients won in that same period |
Common misclassification errors#
One failure mode is undercounting acquisition-related personnel or overhead, which makes CAC look better than it is. Another is mixing delivery costs into CAC, which makes it harder to tell whether the real problem is acquisition economics, service economics, or both.
Use CAC as a decision control for how much you can afford to spend to win business and as the baseline for the next step, where you compare acquisition cost against lifetime value (LTV). If you want a deeper dive, read How to Calculate Your Billable Rate as a Freelancer.
Step 2: Beyond Revenue: Calculating a "Quality-Adjusted" LTV#
Once fully loaded CAC is in place, the next job is to clean up the value side. Calculate client value in two steps: baseline LTV first, then adjust for admin drag and payment risk. Revenue that arrives late, creates rework, or ends in reversals is generally less useful to cashflow than revenue from low-friction clients.
Standard LTV can overstate value because it treats low-friction and high-friction revenue as equivalent. In practice, this often shows up in your invoicing timeline, communication load, and non-billable cleanup work.
Calculate baseline LTV first#
Start with one consistent baseline across accounts using a clearly defined revenue view for each client. Keep that baseline definition consistent across accounts, then adjust it using verified internal records, not memory.
Quality-Adjusted LTV starts with baseline LTV, then applies verified administrative-drag and payment-risk adjustments.
Score drag using observable behavior#
Use a simple internal scale only if each score maps to behavior you can actually observe in your systems.
| Drag factor | Score 1 | Score 3 | Score 5 | Evidence capture |
|---|---|---|---|---|
| Payment timeliness | Paid by due date, no reminder needed | Occasional late payment or one reminder | Repeated late payment, multiple reminders, disputed due dates | Log due date, paid date, and reminder count in invoicing; keep each invoice event on the client record |
| Communication overhead | Questions are grouped, decisions are clear, few unplanned calls | Periodic email sprawl or extra meetings | Constant fragmented messages, repeated clarifications, frequent interruptions | Track client email/meeting volume in CRM or inbox tags; note off-scope communication when it occurs |
| Scope adherence and rework load | Follows agreed brief and change process | Some revision creep or boundary testing | Frequent scope creep, repeated rework, resistance to change orders | Log revision rounds, change requests, and unbilled rework time in your project tracker or CRM |
| Payment-risk outcomes | No refunds, cancellations, or chargebacks | One isolated reversal or pause | Repeated refunds, cancellations, chargebacks, or reactivation patterns | Track refunds, cancellations, chargebacks, and reactivation status in invoicing and CRM |
Keep one canonical client identity across CRM, inbox, and invoicing, and deduplicate aliases so histories are not split across systems. That prevents split histories and makes your adjustment repeatable.
Once each account has an adjusted LTV, rank accounts by that value and compare it against fully loaded CAC. That ranked view sets up the next step: the CPQ portfolio framework.
This pairs well with our guide on Moving From Hourly to Project Rates Without Hurting Cashflow.
The New North Star: The Client Portfolio Quality (CPQ) Framework#
Use CPQ as a weekly triage tool, not a vanity metric. Once you have a Quality-Adjusted LTV for each client, CPQ helps you decide which accounts to protect, which to repair, and which to restructure or exit. It does that by comparing client value with profitability, delivery load, and stress risk.
CPQ = Quality-Adjusted LTV / True CAC
You are comparing reliable client value against the real cost to win that client. The standard LTV:CAC ratio is a broad efficiency metric, and this CPQ version is an internal operating framework for day-to-day decisions when the value side reflects drag and payment risk.
Use CPQ in your weekly review#
Run the same sequence each week from the same systems: invoicing, CRM, inbox tags, and your project tracker. Keep one canonical client record across tools before scoring, or your inputs can be distorted.
- Recalculate CPQ for each active client using the latest verified Quality-Adjusted LTV and True CAC.
- Sort clients from highest to lowest score.
- Assign one action label per client: retain, repair, restructure, or exit.
- Confirm any score change with records before acting.
A score should move because observed behavior changed, not because the week felt harder. Check paid date versus due date, reminder count, revision rounds, meeting volume, refunds or cancellations, and unbilled cleanup time.
Read the score as an operations signal#
High scores can point to clean operations: on-time payment, controlled scope, and lower interruption load. Low scores can mean acquisition cost is too high for the return, delivery friction is rising, or both.
Treat benchmarks carefully. Ratios below 1.0 are commonly framed as value-destructive, and >3.0 is often described as good, but fixed costs, retention, and CAC can all shift over time. For your portfolio, the strongest use is relative ranking: where your attention creates the best return right now.
Working portfolio tiers#
Use tiers to force decisions. These score bands are placeholders until your final rubric is validated.
| Portfolio tier | What you're seeing | Immediate action | Next review trigger |
|---|---|---|---|
| Retain and deepen | High score placeholder band; often shows clean payment behavior, low rework, clear communication, and healthy margin after drag. | Protect the account, renew early, and expand only within your current process. | Any drop in payment timeliness, scope discipline, or communication load. |
| Manage and improve | Mid score placeholder band; can remain profitable, but friction is visible (reminders, extra calls, revision creep, stop-start delivery). | Tighten terms now: reset scope, define response windows, require change requests, and document approvers. | Two review cycles without improvement, or one material payment-risk event. |
| Restructure or exit | Low score placeholder band; often reflects weak value relative to acquisition cost with persistent delivery or collection friction. | Offer revised terms or wind down professionally; stop subsidizing with unbilled labor and attention. | Refusal of revised terms, repeated late payment, or repeated off-scope behavior. |
Protect focus capacity on purpose#
If a mid-tier client is worth keeping, protect your focus with terms you control: tighter scope language, clear response windows, fewer communication channels, and explicit renewal terms. If a low-tier client will not accept those terms, treat that as decision data.
| Evidence | What to review |
|---|---|
| Invoices | Recent invoices and paid dates |
| Reminders | Reminder history |
| Meetings | Meeting count |
| Revisions | Revision rounds |
| Scope changes | Change requests |
| Cleanup work | Unbilled cleanup notes |
For borderline accounts, review a small evidence pack before deciding: recent invoices and paid dates, reminder history, meeting count, revision rounds, change requests, and unbilled cleanup notes. That keeps decisions grounded in records instead of recency or mood.
Related: How to Calculate Client Lifetime Value (CLV) for Your Agency.
If you are moving low-CPQ clients to tighter terms, use this free invoice generator to standardize scope, due dates, and payment expectations.
From Metric to Mindset: Building Your Resilient Business#
Use your metrics to make growth decisions early, before friction turns into drift. The goal is practical: steadier margins and clearer boundaries on where to keep spending.
That is the real shift here. Instead of treating the LTV:CAC ratio as a report, use it as an operating habit. When acquisition costs rise, weak decisions get expensive faster. If winning customers costs more than those customers are worth over time, growth destroys value instead of creating it.
Treat weak economics as operational data#
Weak economics is not background noise. It is operating data. If CAC rises while LTV stays flat, log it and investigate.
Use one recurring review for the metrics that belong together: CAC, RoAS, and LTV. Verify the record before acting so one short swing does not drive a bad decision.
Ignoring repeated deterioration is also a decision. A channel can look fine on top-line results while real value keeps eroding.
Run a keep, fix, or exit decision after each review cycle#
After each review cycle, assign one status using your own thresholds and observed trend direction.
| Status | When it applies | Action |
|---|---|---|
| Keep | LTV remains comfortably above CAC and performance is stable | Keep investing |
| Fix | Performance is recoverable but margins are tightening | Adjust the acquisition plan |
| Exit | CAC continues to outrun customer value after reasonable changes | Pull back |
Review the full picture, not one number#
Do not let one metric do all the work. Review CAC, RoAS, and LTV together. RoAS is useful for short-term campaign performance, but it does not capture acquisition cost or long-term value on its own. An LTV-based RoAS view can give a broader read by combining acquisition cost with long-term revenue. That is how you avoid the $100-versus-$80 failure mode: activity that looks busy but destroys value.
Set a cadence you can keep#
Set a recurring cadence you can maintain, such as lighter monthly check-ins and deeper quarterly reviews. Update CAC, RoAS, and LTV consistently, then reassign where to keep investing, where to fix, and where to pull back.
Use verified internal thresholds and apply them consistently. A 3:1 LTV:CAC ratio is often used as a directional target, but the right target depends on your model and margins.
For a related planning framework, see How to Set Sales Quotas for a SaaS Team.
When you are ready to run invoicing, balances, and payouts in one workflow with audit-ready visibility where supported, explore Gruv for freelancers.
Frequently Asked Questions
How do you calculate True CAC without fooling yourself?
Calculate CAC in one consistent window: acquisition-focused sales and marketing expenses divided by new customers won in that same period. Keep the inputs aligned to new-acquisition activity so costs and customer counts match. As a math check, if spend is $300 and new customers are 200, CAC is $1.50.
What is a good ltv to cac ratio?
Use benchmark ratios as context, not as a fixed rule. Common reference points are above 3, below 1, and 1:1 as a no-profitability warning, but they are not universal for every business model. Treat any CPQ-specific threshold as unvalidated unless you have your own supporting data.
How do you calculate LTV for a single client?
Use the same definition from above: LTV is the revenue or margin you receive from one client over that client’s lifetime. Match cadence when you calculate it, so monthly revenue pairs with monthly churn and annual revenue pairs with annual churn. A common setup uses three inputs: average revenue from newly acquired customers, recurring gross margin, and revenue churn.
When should you use the traditional ratio and when should you use CPQ?
Use traditional LTV:CAC for a broad acquisition-efficiency read and profitability context. If you use CPQ for account-level decisions, treat it as an internal framework; this section does not establish a standard CPQ formula or benchmark bands.
What client behaviors should trigger a CPQ review?
If you use CPQ, set review triggers from your own historical account data and apply them consistently.
What should you verify before you restructure or exit a client?
Verify the underlying data before you act: the revenue, margin, churn, and acquisition-cost inputs behind your decision. This reduces decisions driven by noise and keeps account actions tied to measured economics.
Should you track CAC Payback Period too?
Yes, track it alongside LTV:CAC. CAC Payback Period shows how long it takes to recover acquisition spend, so it is a practical break-even checkpoint. A healthy ratio with slow recovery can still pressure resources, so review spend pace before adding more volume.
What is the easiest way to improve CPQ without chasing more clients?
Start by validating your CPQ inputs against actual outcomes, then adjust rules based on that evidence.
Try a related tool
Researched and edited by the Gruv editorial team. Gruv builds cross-border billing, payouts, and finance-operations software for global businesses.
Sources
Includes 6 external sources outside the trusted-domain allowlist.
- online.hbs.edu/blog/post/ltv-cactrusted
- baremetrics.com/blog/what-is-the-ltv-to-cac-ratioexternal
- blog.hardfin.com/calculating-the-ltv-to-cac-ratio-metric-corr...external
- corporatefinanceinstitute.com/resources/accounting/customer-acquisition-co...external
- gruv.ai/blog/a-guide-to-lifetime-value-ltv-to-cac-ratioexternal
- quickbooks.intuit.com/r/small-business-data/small-business-late-pa...external
- thesaascfo.com/ltv-to-cac-ratio-of-threeexternal
Educational content only. Not legal, tax, or financial advice.
Related Posts

How to Calculate a Freelance Rate You Can Actually Get Paid On
A workable rate is not the neat number a calculator produces. It is the number that still works after you account for real billable capacity, non-client time, scope drift, and the gap between sending an invoice and receiving cleared cash. Start with hourly math even if you do not plan to bill hourly, then turn that number into a quote with clear `payment terms`.

How to Calculate Client Lifetime Value (CLV) for Your Agency
To make pricing and acquisition decisions you can defend, use a consistent view of Customer Lifetime Value (CLV), whether revenue-only or margin-aware. This guide is for freelancers, creators, and small agency teams that invoice clients and need decisions that hold up under day-to-day planning pressure.

How to Calculate Customer Acquisition Cost (CAC)
--- Standard corporate metrics often break down for independent professionals. Customer Acquisition Cost, or CAC, is a good example. The textbook formula - total sales and marketing spend divided by new customers - leaves out your most valuable asset: your time.