
Quick Answer
Start with a three-act flow for seo client reporting: decision first, proof second, and commitments last. Open with the business outcome and the approval you need, then use only goal-linked evidence instead of a KPI dump. Close with priority theme, owner, dependency, and next checkpoint so the report triggers action. For bad-news periods, verify the drop in source platforms before naming causes, and present recovery steps with a clear update point.
The Client Leadership Framework: Transform Your SEO Report from a Defensive Chore into a Strategic Weapon#
Treat your report as a decision conversation, not a receipt for your fee. In reporting, leadership means you own the recommendation. You translate search performance into business impact, and you align the next step before the client has to ask what any of it means.
The usual failure is not bad charts. It is the gap between data and outcomes. If you lead with a 15% jump in organic traffic but cannot connect it to leads, sales, lower acquisition cost, or revenue, you are handing over activity, not value. Leadership reporting closes that gap by putting the numbers in business context and making a clear call about what changed, why it matters, and what you want approved or prioritized next.
A quick posture check#
| If your report sounds like this | You are acting like a vendor | You are acting like a leader |
|---|---|---|
| Focus | "Here are rankings, traffic, and backlinks." | "Here is the business impact those signals point to." |
| Interpretation | Client has to infer what matters. | You explain what changed and why it matters now. |
| Close | "Let me know if you have questions." | "Here are the next actions I recommend." |
Before you build the report, write down three things so the rest of the document stays focused:
- Who will read it first: founder, marketing lead, or someone else?
- What decision should it drive: approve content, fix conversion paths, or reset expectations?
- What business question must it answer: more qualified leads, better conversion from organic traffic, or stronger share against competitors?
One useful check is competitive benchmarking. If you claim opportunity, verify it against key rivals so you can show where the client is actually winning or losing share. A reliable red flag is any chart that looks impressive but does not support a business question or a next action. Cut it.
That stance shapes everything that follows. The next step is to turn it into a report format you can reuse consistently. Related: The Best Analytics Tools for Your Freelance Website.
The Three-Act Structure for Strategic Reporting#
Build every report in three acts: decision, evidence, and action. If a section does not help the client decide, understand, or commit, remove it.
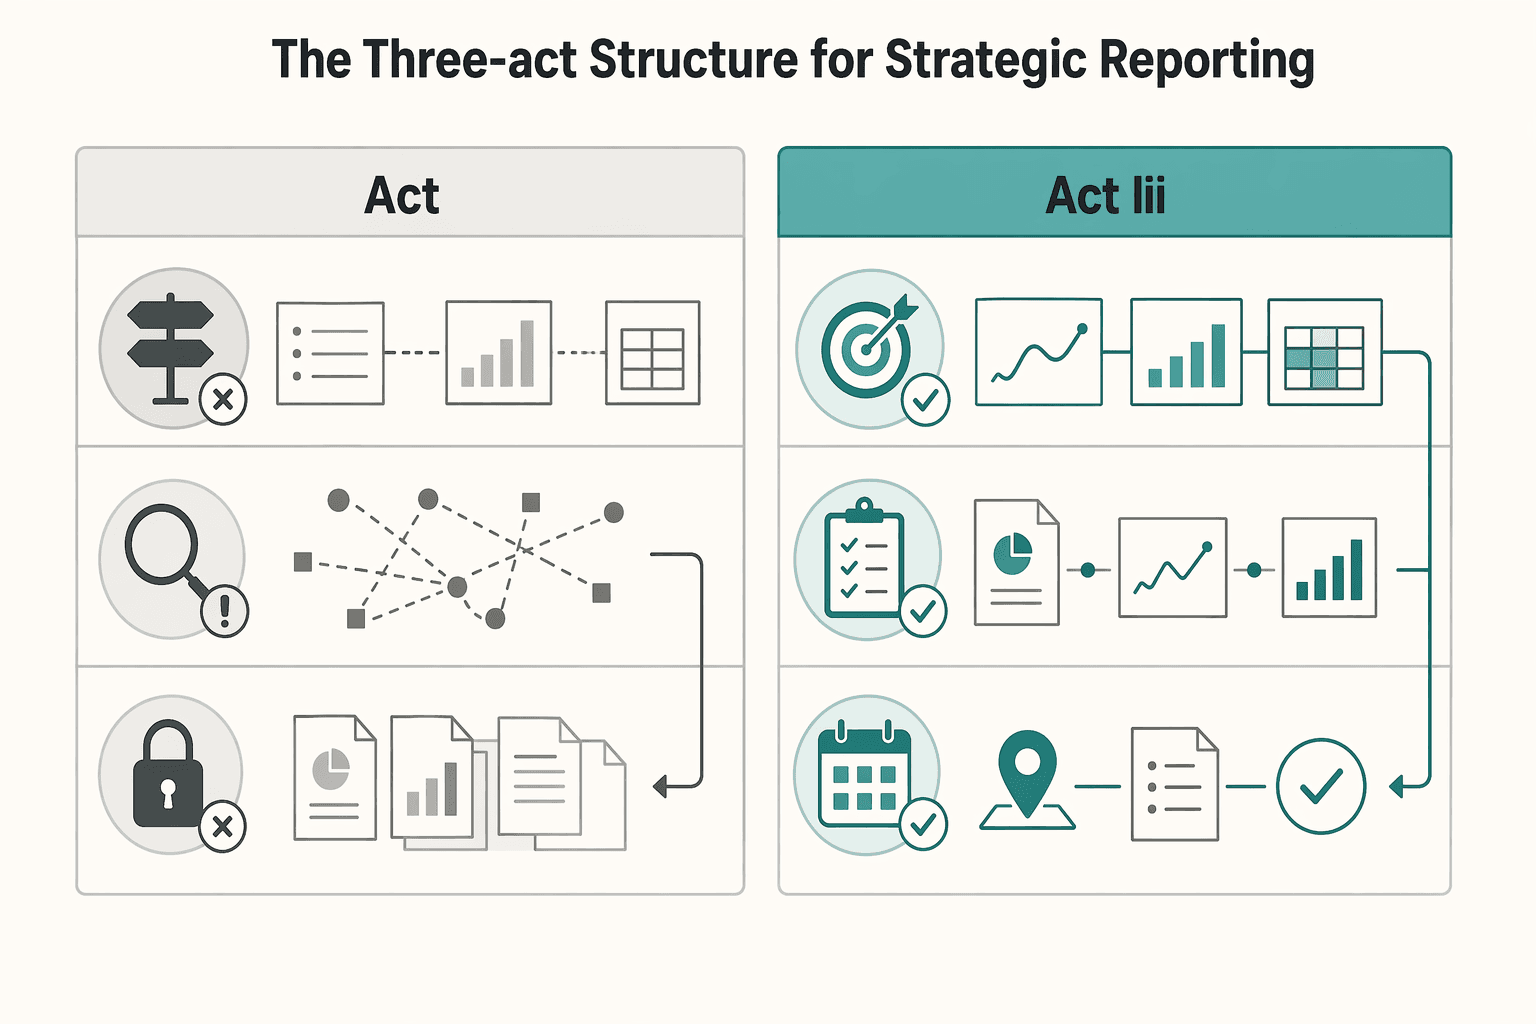
Use this structure to deliver clarity, proof, and next steps in a repeatable workflow. Your role is to explain what changed, why it matters now, and what should happen next.
| Act | Include | Avoid | Expected client takeaway |
|---|---|---|---|
| Act I | Business outcome, what changed, why it matters now, and the decision you want next. | Opening with rankings screenshots, traffic charts, or task logs without a clear judgment. | "I understand the situation and the decision in front of me." |
| Act II | Evidence chain: visibility -> qualified traffic -> business outcomes, using only goal-aligned KPIs. | KPI dumps that force the client to infer relevance on their own. | "The recommendation is supported, and I can see the tradeoffs." |
| Act III | Priority themes with action, owner, dependency, risk watchout, and next checkpoint. | Closing recap text with no commitments, owners, or timing. | "We are aligned on what happens next and who owns it." |
Act I#
Start with a decision-first executive brief. In a short opening, state four things in order: the business outcome, what changed, why it matters now, and the decision you want approved next.
Do not lead with raw activity unless it connects to a business goal. If results are mixed, say that directly. Clarity builds trust faster than optimistic framing.
Before sending, run one check: every claim in this brief must be supported in Act II. If a claim is not supported, rewrite it as a hypothesis or remove it.
Act II#
Prove your recommendation with an evidence chain, not a metric dump. Show visibility first, then qualified traffic, then business outcomes so the client can follow cause and impact.
Apply strict metric selection rules:
- Include rankings, backlinks, and technical health only when they explain movement in qualified traffic or conversion performance.
- Prioritize conversion-relevant metrics over raw volume. If a KPI does not tie to goals or a decision, cut it.
- Keep routine reporting monthly, then use quarterly deep dives for broader business-impact patterns.
A practical evidence set can include traffic, rankings, conversions, backlinks, technical health, and key insights, but you do not need every item in every report. If activity increased without moving goal-relevant outcomes, present that plainly and explain the implication.
Act III#
End with commitments, not a recap. Whether you report in a PDF, live dashboard, or custom template, your final section should make ownership and timing explicit.
Use this action-plan format for each priority theme:
| Priority theme | Action | Owner | Dependency | Risk watchout | Next review checkpoint |
|---|
This is where reporting becomes execution. Document blockers, assign owners, flag risks early, and set the next monthly checkpoint, with a broader quarterly business-impact review.
For a step-by-step walkthrough, see How to Create a Social Media Report for a Client.
Building Your Argument: Choosing Metrics That Tell a Story of Value#
Your metric set should justify a decision, not describe activity. For SEO reporting to clients, choose business outcomes first, add leading indicators that explain movement, and include diagnostic metrics only when they identify what to fix next.
Pick metrics by decision, not by habit#
Start with a one-sentence reporting thesis, then test every metric against it. The filter is simple: what decision does this metric support?
Map each reported metric to one client decision before you include it:
- Business outcomes: qualified leads, pipeline, or revenue from organic search.
Decision supported: budget, scope, and priority.
- Leading indicators: organic traffic to conversion pages, visibility in high-intent topic clusters, or non-branded search presence.
Decision supported: where growth is coming from and whether it matches goals.
- Diagnostic metrics: indexation, technical health, or click-through rate.
Decision supported: what is blocking performance and what to fix first.
If rankings and total traffic rise but growth is disconnected from the offer that matters, call it mixed performance and state the next action clearly.
Before sending, run one evidence check: confirm correlations, trends, outliers, and comparisons support your conclusion. If they do not, rewrite the claim as a hypothesis or remove it.
Use Share of Voice as a scoped check, not a slogan#
Use Share of Voice only when the scope is explicit enough to guide action. Avoid broad claims; define exactly what is tracked.
Record these in your report notes or dashboard definition:
- Topic cluster: Pending client/source verification
- Competitor set: Pending client confirmation
- Reporting cadence: Pending client confirmation
This keeps trends trustworthy. If scope changes are undocumented, comparisons become weak and decisions get harder.
Show attribution views side by side#
Attribution models distribute conversion credit across touchpoints, and model choice can change budget and priority decisions. Last-click views can understate SEO when organic influence happens earlier in the journey, so show multiple views when the path is not single-touch.
| Attribution view | What it highlights | Interpretation risk | Decision it can support | Current value |
|---|---|---|---|---|
| Last click | Which channel closed the conversion | May understate SEO when organic influenced earlier steps | Whether organic is consistently finishing demand for specific offers | Pending source verification |
| Assisted conversions | Where organic contributed without closing | Can be overstated if "assist" is not clearly defined | Whether SEO supports multi-touch journeys and should keep budget protection | Pending source verification |
| First touch | Where discovery started | Can over-credit early awareness if later steps underperform | Whether SEO is creating initial demand worth scaling | Pending source verification |
If the client prefers last-click, keep it, but add assisted and first-touch views when the journey includes multiple interactions. Label the attribution model directly in each chart title so interpretation stays clear.
The Risk Mitigation Playbook: Mastering Tough Conversations#
When performance dips or scope expands unexpectedly, lead with evidence, impact, and the next commitment. Use the Red Flag Protocol for incidents and the SOW Shield for change requests so the conversation stays calm, specific, and decision-ready.
| Response style | Message framing | Evidence used | Likely client outcome |
|---|---|---|---|
| Reactive response | "Traffic is down, but we're looking into it." | Broad totals, loose explanations, no segmented check | Anxiety, follow-up pressure, low confidence |
| Risk-managed response | "Qualified organic leads are down in this segment. We verified where the drop started, what it affects, and what we recommend next." | Business outcomes first, then segmented reporting by product, page type, or location | More trust, faster decisions, clearer ownership |
Red Flag Protocol#
Use this workflow as your call script when a negative trend appears in metrics tied to the client's goal.
- Detection trigger
"We saw a meaningful negative shift in the business metric we track most closely, so I wanted to bring you a verified read before assumptions spread." Lead with business outcomes first, then use traffic and rankings as supporting context.
- Verified root-cause check
Confirm the pattern before naming a cause. Segment by product, page type, and location to find where the change started and whether it is isolated or broad. If verification is incomplete, say it is under investigation rather than confirmed.
- Client-facing impact summary
Keep this tight and concrete: what changed, where it changed, and what it appears to affect. If either detail is unresolved, say "The affected segment is pending verification, and the business impact is still under review."
- Time-bound recovery plan
When actions are not verified yet, say so directly: "Next steps are pending root-cause review, and the first recovery checkpoint is pending client confirmation." Before ending the call, confirm one commitment: owner and date for the next update.
SOW Shield#
When a new request comes in, do not approve or reject it on the spot. Route it through the report's forward-looking roadmap so tradeoffs are explicit.
- Request intake
"Let me capture the request exactly so we assess the right thing."
- Fit-to-goals check
"Help me connect this to the current goal. Is this meant to improve qualified leads, support a specific offer, or address another risk?"
- Resourcing impact
"To do this properly, we need to move time from an agreed roadmap item or add capacity."
- Formal reprioritization path
"If you want this in the current period, let's agree what gets deprioritized and update the roadmap in writing."
Document four items every time: the request, the business reason, the tradeoff against existing work, and the final client decision. That record protects continuity when timelines shift and stakeholders change.
We covered this in detail in How to Conduct a Technical SEO Audit for a Client Website.
The Efficiency Engine: A System for High-Impact Reporting#
If you still assemble the report right before the client call, you stay reactive. The goal is to automate repetitive reporting work so you can spend your time on interpretation, communication, and clear recommendations.
Workflow map for seo client reporting#
Run reporting as four separate jobs. Each has different failure points, so each needs its own checks.
- Data collection
Pull recurring data from the same sources, in the same order, on the same day each cycle. Manual copying across platforms takes time, so automate collection where possible. Set one fixed cutoff for each cycle so month-to-month comparisons stay clean. If the cutoff is not confirmed yet, mark it as pending client/source confirmation rather than changing it ad hoc.
- Data QA
Validate pulled numbers against source platforms before you draft commentary. Check one top-line total and one segmented view, for example branded vs non-branded or key landing page groups. This is where you catch connector breaks, refresh delays, siloed gaps, or attribution issues before they mislead the client.
- Narrative drafting
Lead with the business readout, then use charts as evidence. Your month-end summary should answer: what changed, why it likely changed, and what that means for the business. Clicks and impressions can stay in the report, but they should support the story, not replace it.
- Decision prep
End with one decision the client should make or approve by the confirmed decision deadline. If the date is not confirmed yet, label the timing as pending client confirmation. If the report does not trigger a decision, it becomes a status archive.
Choose your stack deliberately#
Different reporting setups trade setup effort for reliability risk and maintenance load.
| Reporting approach | Typical setup effort | Typical data reliability risk | Typical maintenance load |
|---|---|---|---|
| Native platform dashboards | Low to medium | Lower when you stay in one source; higher when cross-platform comparison is manual | Low in-platform; higher when you need cross-channel context |
| Connector-based reporting stacks | Medium to high | Medium, because connector failures, field mapping issues, or refresh delays can distort totals | Medium to high, especially when schemas change |
| All-in-one agency tools | Medium | Medium, depending on source coverage and metric standardization | Medium, with less custom work but less flexibility |
If you need tailored cross-platform analysis, a connector stack can be worth it. If the client mainly needs source-level visibility with fewer moving parts, native dashboards are often easier to keep consistent.
Governance and cadence#
A single source of truth only works when you define how it runs. Document metric definitions, who checks each metric, expected refresh behavior, and a lightweight issue-log process. In the issue log, record the affected metric, whether cause is confirmed or still under review, and the next update date.
Keep report cadence tied to decisions, not just visibility. A monthly report should answer: what changed this month, and does it require intervention now? If you run a quarterly review, use it to decide whether the current direction still fits trend, execution reality, and business impact, then adjust the roadmap accordingly.
You might also find this useful: How to Automate Client Reporting with Google Data Studio and Supermetrics.
Conclusion: Stop Reporting. Start Leading.#
A useful report should make a decision easier. If your update only lists rankings, sessions, and completed tasks, the client still has to figure out what matters, what changed, and what should happen next.
Keep the structure simple: start with business impact, back it up with evidence, then end with a short next-step roadmap. Put conversions, leads, revenue, or another goal-aligned outcome at the top because many stakeholders will not read past the executive summary. Under that, show the evidence with the right comparison baseline. Month over month explains recent movement. Year over year adds seasonality and longer-term context.
Before each report goes out, do three checks so the report can be read quickly and acted on:
- Clarify the decision. Confirm who the report is for and what decision it should support. If the audience is a founder, keep it tighter and more commercial. If it is a marketing lead, include more channel detail and assumptions.
- Surface the risk. Call out the issue early, whether that is a tracking gap, a traffic drop, or pages that are not converting. A red flag without context forces stakeholders to interpret the numbers on their own, which lowers confidence fast.
- Set the next actions and owner. End with the action, the owner, and the timing. If no change is recommended, say that directly so the client knows the current course is intentional.
That is where a reporting deliverable becomes useful client communication. Clear context and recommendations can reduce confusion, support alignment, and build trust over time. That matters more than a polished chart deck.
Use this prompt every cycle: if the client reads only the first section, will they know what changed, why it matters, and who is doing what next?
This pairs well with our guide on Best Video Conferencing Tools for Freelancers in Client Meetings.
Frequently Asked Questions
How should you explain a drop in traffic to a client?
Start with verification, not certainty. Confirm the drop in source platforms first, then state potential drivers as hypotheses until you can verify them. A useful line is: “Organic sessions are down month over month. We’ve confirmed the drop in source data, and we’re validating the likely drivers before naming a final cause.” Then close with the next action, owner, and update date.
What is the difference between a report and a strategy discussion?
A report tells what changed. A strategy discussion decides what to do about it. Many teams separate a recurring performance update from a less frequent strategic review so decisions stay clear. That distinction matters because a good report should turn data into prose and action, not just charts.
How do you show ROI when SEO rarely gets full credit?
Use an evidence stack, not one formula. Prioritize business-impact framing, such as pipeline influence, instead of traffic-only reporting. Map what you present to the client’s real data sources, and clearly label what is confirmed versus directional.
Which reporting setup fits your situation?
Pick the lightest option that still gives you trustworthy numbers and a usable story for each audience. In general, white-label reporting tools are positioned around API-driven automation and branded outputs, while manual reporting relies on hand-entered spreadsheets or docs. Some white-label workflows are described as: connect APIs, upload a logo, set brand colors, and generate reports. | Option | Best fit use case | Strengths | Tradeoffs | |---|---|---|---| | White-label SEO reporting tools | Agencies that need branded, repeatable reporting | API-driven automation and client-facing branding | Setup and data quality still need validation in your environment | | All in one SEO platforms | Teams that want reporting plus SEO tooling in one place | Consolidated workflow across reporting and SEO tasks | Flexibility can be lower than a fully custom setup | | Manual spreadsheets or docs | Very small client loads or one-off reporting | Full control over wording and layout | Manual data entry can take significant time and increases copy risk |
How often should you send reports?
Use cadence based on the decisions your stakeholders need to make, not habit. There is no single required schedule that fits every team. If nothing new needs a decision, say that plainly and confirm the recommendation to stay the course.
What metrics belong in every SEO report?
Lead with business outcomes first, then supporting indicators, then diagnostics. That usually means pipeline influence or other business-impact measures at the top, with visibility and performance metrics underneath. Do not stop at traffic alone: many searches can end without a click, so visibility signals can matter when tied to a real business question.
Try a related tool
Researched and edited by the Gruv editorial team. Gruv builds cross-border billing, payouts, and finance-operations software for global businesses.
Sources
Includes 7 external sources outside the trusted-domain allowlist.
- europarl.europa.eu/doceo/document/CRE-10-2026-03-11_HU.htmltrusted
- 97thfloor.com/articles/playbooks/the-seo-strategists-playb...external
- agencydashboard.io/blog/seo-agency-reportsexternal
- agencyplatform.com/blog/seo-reporting-for-agenciesexternal
- americaneagle.com/insights/blog/post/how-to-generate-seo-reportsexternal
- blog.hubspot.com/marketing/seo-reportexternal
- designmemarketing.com/how-to-create-seo-reportsexternal
- directiveconsulting.com/blog/b2b-seo-best-practicesexternal
Educational content only. Not legal, tax, or financial advice.
Related Posts

Thailand's Long-Term Resident (LTR) Visa for Professionals
For a long stay in Thailand, the biggest avoidable risk is doing the right steps in the wrong order. Pick the LTR track first, build the evidence pack that matches it second, and verify live official checkpoints right before every submission or payment. That extra day of discipline usually saves far more time than it costs.

The Best Analytics Tools for Your Freelance Website
Start with one sequence and keep it boring. Decide the business question. Choose one primary reporting source. Verify tracking against the origin. Then review it on the same day each week. That order matters more than which tool wins your shortlist.

How to Automate Client Reporting with Google Data Studio and Supermetrics
If clients rarely engage with your reports, your value story feels fuzzy, and month-end reporting keeps eating into paid work, the fix is usually not more charts. It is tighter operating discipline. The Client Reporting Flywheel is a practical model for turning reporting into three linked outcomes: proof of value, clearer scope control, and better growth planning.